[an error occurred while processing this directive]
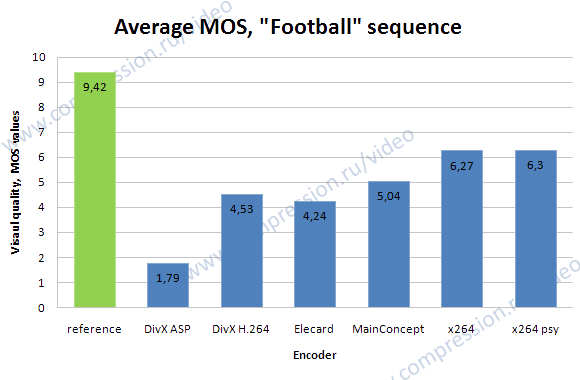
In this work, we analyzed video codecs not only with help of objective metrics, but also using subjective comparisons using SAMVIQ (Subjective Assessment Method for Video Quality evaluation) methodology. This new method was created by the EBU (European Broadcasting Union).
Another task in this part of comparison was to analyze the psycho-visual enhancement quality during encoding. We tested five video codecs, and one codec was tested with two almost identical presets: one without psycho-visual enhancement and another with psycho-visual enhancement.
Using SSIM, the codecs can be ranked as follows:
Interestingly, if Y-PSNR is used as the quality metric, x264 does not exhibit the kind of progress shown in previous figure. This difference is because for past years, the x264 developers specified, for use in testing, the presets optimized for the SSIM metric. Also, note that no encoder (among the different x264 versions) produces the best results simultaneously for both SSIM and PSNR.
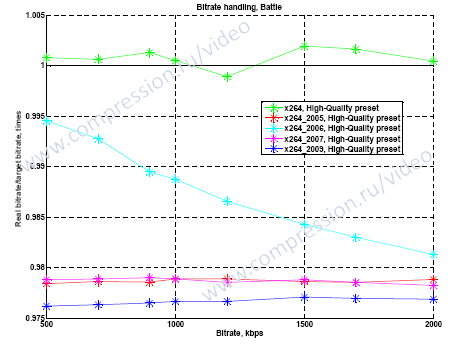
The bitrate handling mechanism for the x264 encoder is quite good for each version, as following figure indicates. Results for previous x264 versions (0.98 of target bitrate) could be explained by a different interpretation of kbps (1,024 versus 1,000 bits per second).
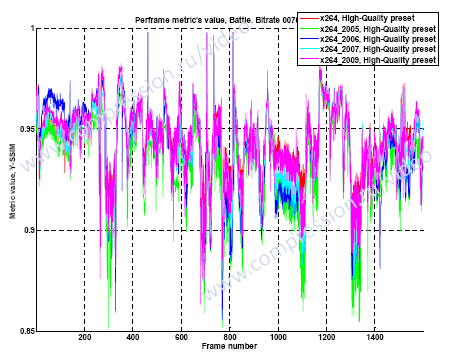
The per-frame analysis presented in following figure shows that the main encoding mechanism did not changed significantly.
The main conclusion is that even in single-thread mode, Theora is a little bit slower and produces much poorer quality than does x264.
[an error occurred while processing this directive]
This sequence is a fragment from the Ice Age 3 animated movie. This movie has low-contrast portions and high-contrast portions, and it has many types of motion: camera panning, slow motion and very fast motion. Also, it has a scene with colors that differ completely from those of other scenes. Small black letterboxes appear at the top and bottom of the video.
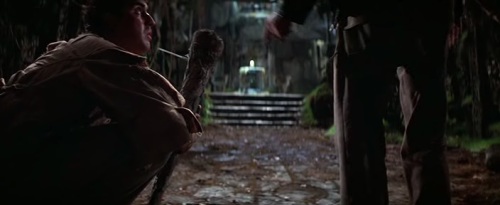
This sequence is a fragment from the Indiana Jones movie. Compression of this sequence is difficult for two main reasons: the presence of low-contrast scenes and the high level of motion in different scenes. Also, several scenes have very different types of motion, ranging from almost static scenes with talking people to scenes with strong motion (for example, the scene where stones fall).
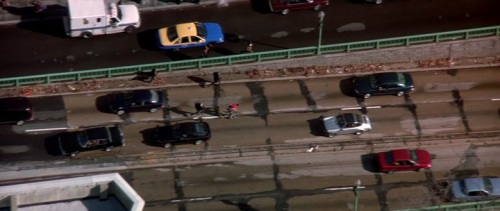
This sequence is a fragment from the Enemy of the State movie. This sequence includes outdoor scenes with strong motion at the beginning when the bicyclist runs, as well as scenes with low motion and indoor scenes with normal motion. This sequence has scenes with different lighting conditions.
This sequence is a fragment from the Up animated movie. The sequence contains low-contrast scenes with almost static brightness and high-colored scenes, and it contains many scenes with a few frames that include quick scene changes.
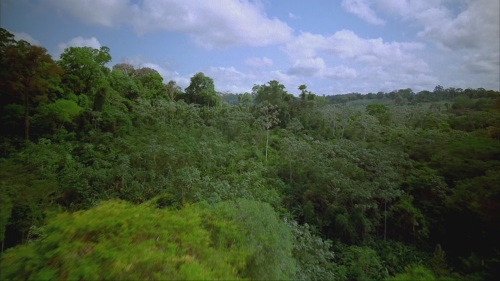
This sequence contains scenes with the camera panning over a landscape view of the Amazon; also, some scene changes take place with the camera panning again. The video frames consist of many edges and high-contrast, sharp details, such as leaves and branches. This sequence was downloaded from the Microsoft website:
http://www.microsoft.com/windows/windowsmedia/musicandvideo/hdvideo/contentshowcase.aspx
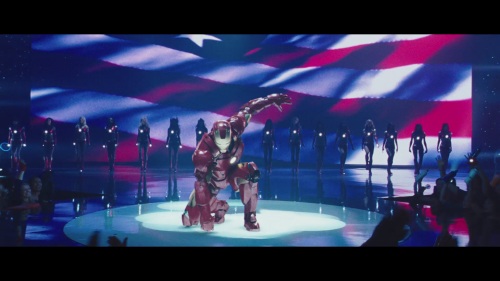
This sequence is a part of the Iron Man 2 movie trailer. It has low-brightness scenes at the beginning, followed by a scene with very fast motion and scenes with slow camera panning. Some frames are very blurry. Also, the sequence contains scenes with flashing lights, which could be a big problem for some encoders. Black letterboxes appear at the top and bottom of the video.
This close-up sequence is similar to �Mobile&Calendar� and includes a moving calendar with text and a detailed photo of the Vasa ship. It also includes a moving train with colorful toys. The background has two types of wallpaper: one is brown with details, and the other is yellow with drawn figures. The sequence is very detailed and is normally demanding. The main potential compression difficulty is the many small, sharp details on the calendar and on the background.
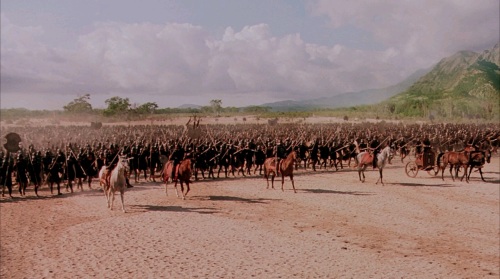
This sequence is a fragment of the �Troy� movie and contains three parts with sharp scene changes. The video includes medium scene motion and slow camera motion. In terms of compression, this sequence is difficult to compress because of the many small details.
Relative bitrate/relative time charts show the dependence on relative encoding time of the average bitrate for a fixed quality output.
The Y-axis shows the ratio of the bitrate of the codec under test to that of the reference codec for a fixed quality.
A lower value (that is, the higher the value is on the graph) indicates a better-performing codec.
For example, a value of 0.7 means that codec under test can encode the sequence under test in a file that is 30% smaller than that
encoded by the reference codec.
The X-axis shows the relative encoding time for the codec under test. Larger values indicate a slower codec.
For example, a value of 2.5 means that the codec under test works 2.5 times slower, on average, than the reference codec.
As a result of these advantages, relative bitrate/relative time graphs are used frequently in this report since they assist in the evaluation of the codecs in the test set, especially when number of codecs is large.
A more detailed description of the preparation of these graphs is given below.
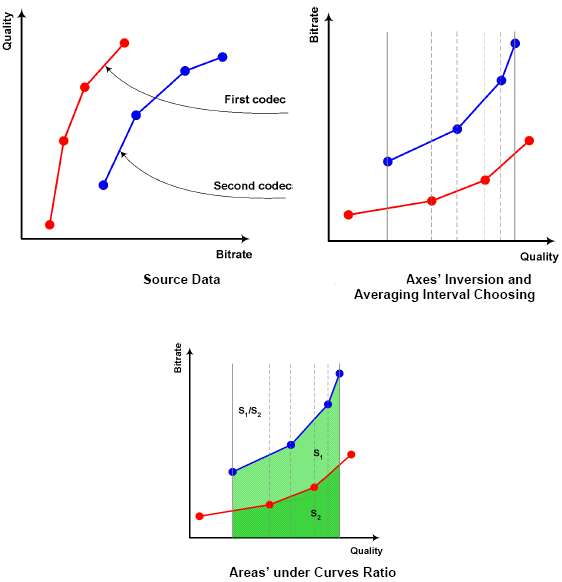
The first step in computing the average bitrate ratio for a fixed quality is inversion of the axes of the bitrate/quality graph
(see next figure). All further computations are performed using the inverted graph.
The second step involves averaging the interval over which the quality axis is chosen.
Averaging is performed only over those segments for which there are results for both codecs.
This limitation is due to the difficulty of developing extrapolation methods for classic RD curves; nevertheless,
for interpolation of RD curves, even linear methods are acceptable.
The final step is calculation of the area under the curves in the chosen interpolation segment and determination of
their ratio (see next figure). This result is an average bitrate ratio for a fixed quality for the two codecs.
If more than two codecs are considered, then one of them is defined as a reference codec and the quality of others is compared
to that of the reference.
To compute the relative processing time of two codecs for a particular video sequence,
the encoding time is calculated for both codecs (the encoding times are summed for all bitrates)
and the ratio is taken. For three or more codecs, one codec is chosen as a reference and the ratio of
its encoding time to that of the others is calculated.
For multiple sequences, each codec is assigned an arithmetic mean of average relative encoding times for each sequence.
Appendix 4. Test Set of Video Sequences
[an error occurred while processing this directive]
Movie Sequences
"Ice Age"

"Indiana Jones"
"State Enemy"
"Up"

HDTV Sequences
"Amazon"
"Iron Man"
"Mobile Calendar"

"Troy"
Appendix 5. Tested Codecs and Presets
[an error occurred while processing this directive]
Codecs
DivX AVC/H.264 Video Encoder
Remarks: Owing to our choice of presets, the results for the DivX H.264 encoder could be slightly diminished compared with the case where the developers provide the presets.
Elecard AVC Video Encoder 8-bit edition
Intel� MediaSDK AVC/H.264
MainConcept AVC/H.264 Video Encoder Console Application
Microsoft Expression Encoder 3
Remarks: Owing to a long initial GUI loading time, the encoding time for Microsoft Expression Encoder is significantly higher than for other encoders. Unfortunately, we were unable to encode multiple files without the GUI loading each time. This is likely one of reasons for the encoder�s poor time results.
Theora encoder
Remarks: Theora�s low encoding speed is explained by the version�s lack of multithreading support. Thus, Theora was tested in single-thread mode.
x264
Remarks: The presets provided by the developers for this comparison were specifically chosen for the SSIM metric
Presets
The table below lists the settings used in this comparison for all of the codecs.
Appendix 6. Figures Explanation
[an error occurred while processing this directive]
The main charts in this comparison are classical RD curves (quality/bitrate graphs) and relative bitrate/relative time charts.
Additionally, bitrate handling charts (ratio of real and target bitrates) and per-frame quality charts were also used.
RD curves
These charts show variation in codec quality by bitrate or file size. For this metric, a higher curve presumably indicates better quality
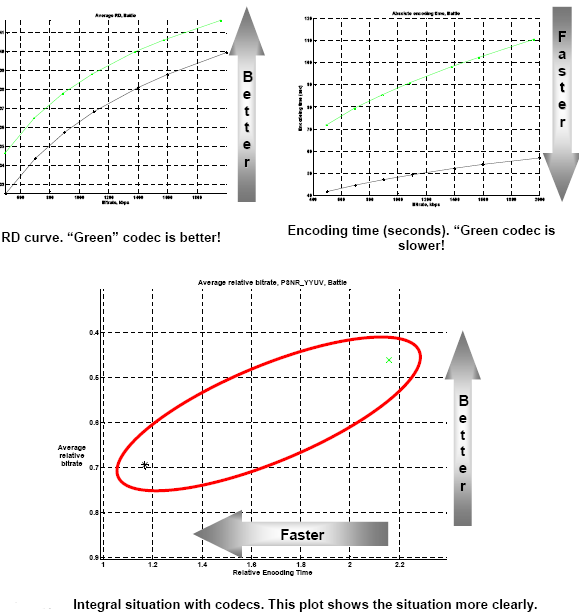
Relative Bitrate/Relative Time Charts
Graph Example
The following figures shows a case where these graphs can be useful.
In the top left graph, it is apparent that the �Green� codec encodes with significantly
better quality than the �Black� codec. On the other hand, the top right graph shows that the �Green� codec is slightly slower.
Relative bitrate/relative time graphs can be useful in precisely these situations: it is clearly visible in the bottom graph
that one of the codecs is slower, but yields higher visual quality, and that the other codec is faster, but yields lower visual quality.
Bitrates Ratio with the Same Quality
Relative Codec Encoding Time Computation
Appendix 7. Objective Quality Metrics Description
[an error occurred while processing this directive]
SSIM (Structural SIMilarity)
Brief Description
was published by Wang, et al (Zhou Wang, Alan Conrad Bovik, Hamid Rahim Sheikh and Eero P.
Simoncelli, �Image Quality Assessment: From Error Visibility to Structural Similarity,�
IEEE Transactions on Image Processing, Vol. 13, No. 4, April 2004).
The SSIM author homepage is found at the following URL: http://www.cns.nyu.edu/~lcv/ssim
The scheme of SSIM calculation can be presented as follows. The main idea that underlies the structural similarity (SSIM) index is comparison of the distortion of three image components:
The final formula, after combining these comparisons, is the following: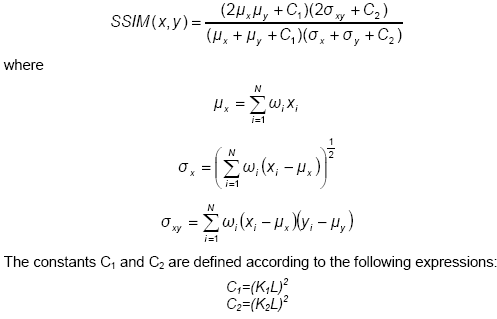
L is the dynamic range of the pixel values (255 for 8-bit grayscale images), and K1, K2 << 1.
The values K1 = 0.01 and K2 = 0.03 were used for the comparison presented in this report, and the matrix filled with a value �1� in each position to form a filter for the result map.
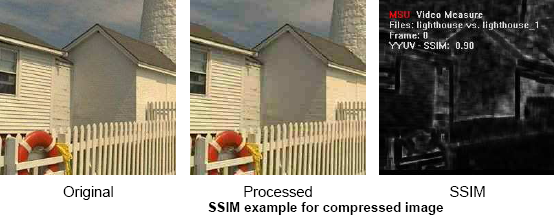
For the implementation used in this comparison, one SSIM value corresponds to two sequences. The value is in the range [-1, 1], with higher values being more desirable (a value of 1 corresponds to identical frames). One of the advantages of the SSIM metric is that it better represents human visual perception than does PSNR. SSIM is more complex, however, and takes more time to calculate.
The following is an example of an SSIM result for an original and processed (compressed with lossy compression) image. The resulting value of 0.9 demonstrates that the two images are very similar.
The following are more examples how various types of distortion influence the SSIM value.
[an error occurred while processing this directive]
The SSIM values for the Y-plane for these images are given below.
[an error occurred while processing this directive]
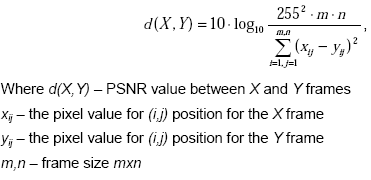
Generally, this metric has the same form as the mean square error (MSE), but it is more convenient to use because of the logarithmic scale. It still has the same disadvantages as the MSE metric, however.
In MSU Video Quality Measurement Tool the PSNR can be calculated for all YUV and RGB components and for the L component of LUV color space. The PSNR value is quick and easy to calculate, but it is sometimes inappropriate as relates to human visual perception.
A maximum deviation of 255 is used for the PSNR for the RGB and YUV color components because, in YUV files, there is 1 byte for each color component. The maximum possible difference, therefore, is 255. For the LUV color space, the maximum deviation is 100.
The values of the PSNR in the LUV color space are in the range [0, 100]; the value 100 means that the frames are identical.
| Name | Encoding parameters |
|---|---|
| good1 |
First pass: -p 2 --pass=1 --fpf=tmp.fpf --threads=4 --good --cpu-used=1 --end-usage=0 --auto-alt-ref=1 -v --minsection-pct=5 --maxsection-pct=800 --lag-in-frames=16 --kf-min-dist=0 --kf-max-dist=999999 --token-parts=2 --static-thresh=0 --min-q=0 --max-q=63
Second pass: |
| good2 | The same as good1, but --cpu-used=2 |
| good3 | --cpu-used=3 |
| good4 | --cpu-used=5 |
| good5 | --cpu-used=5 |
| best | The same as good1, but --best instead of --good and without --cpu-used |
We've been following the MSU tests since they began and respect the group's work. One issue we noticed in the test is that most input sequences were previously compressed using other codecs. These sequences have an inherent bias against VP8 in recompression tests. As pointed out by other developers, H.264 and MPEG-like encoders have slight advantages in reproducing some of their own typical artifacts, which helps their objective measurement numbers but not necessarily visual quality. This is reflected by relatively better results for VP8 on the only uncompressed input sequence, "mobile calendar."
Even with this limitation, VP8 delivered respectable results against other encoders, especially considering this is the first time VP8 has been included in the test and VP8 has not been specifically optimized for SSIM as some other codecs have.
To date, WebM developers have focused on the VP8 decoder performance and are only starting to optimize the encoder for speed. The WebM project has only been underway for three weeks, and we believe that our encoder speed will improve significantly in the near future.
[an error occurred while processing this directive] |
MSU video codecs comparisons resources: