[an error occurred while processing this directive]
[an error occurred while processing this directive]
MSU Quality Measurement Tool: Metrics information
[an error occurred while processing this directive]
Metrics Info
[an error occurred while processing this directive]
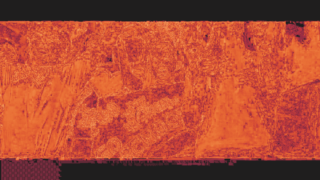
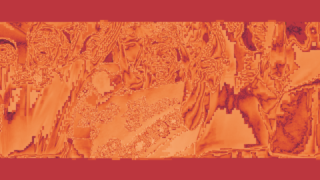
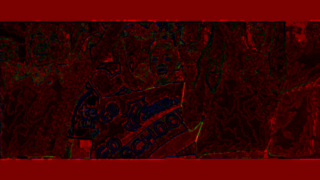
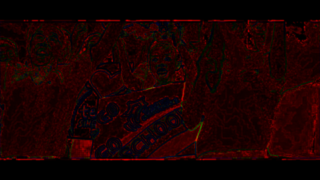
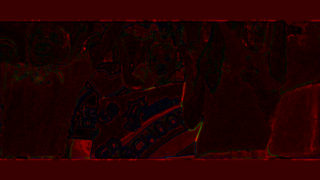
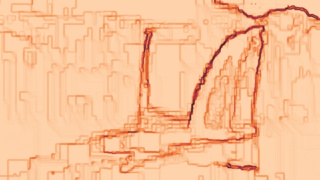
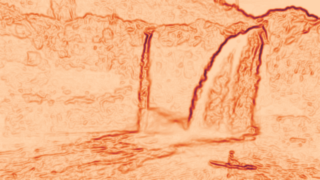
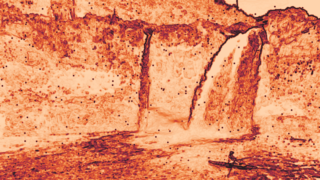
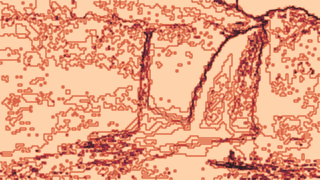
Peak signal-to-noise ratio (PSNR)
General info
- Metric type:
- full-reference
image
metric
- Value range:
- (completely different) 0..100 (similar to original)
- Value interpretation:
- bigger is better quality
- MSU VQMT implementaions:
- cpu multithreaded
- MSU VQMT visualization:
- pixel-wise
- Available colorspaces:
- R, G, B, Y, U, V, L, RGB, YUV
- Output values:
- metric value
- Aggregated values:
- standard set
, total PSNR
- MSU VQMT usages:
-metr psnr [over <color components>]- External references:
- Wikipedia
Algorithm description
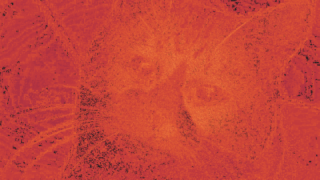
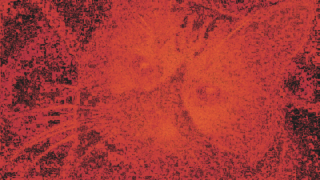
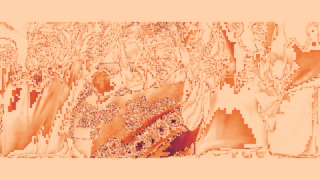
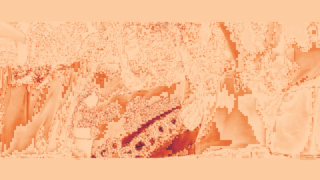
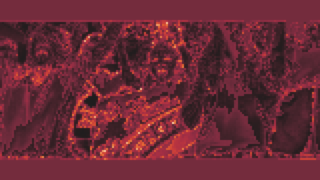
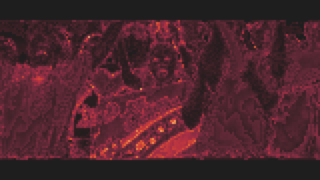
Metric depends only on difference of original and distorted, and more preciesly, only on -norm of this difference (see MSE). Unlike MSE, metric has logrithmic scale and can be calculated using the following formula:
where MaxErr - maximum possible absolute value of color component (MaxErr=1 in VQMT), w - video width, h - video height.
Total PSNR is aggregated value, that considers all processed frames as a single huge image and then calculates PSNR. Total PSNR takes into account sum suqared distortion on all frames, and doesn't distinguish situation where all distorion on one frame from situation where it is distributed across all frames. While arithmetic mean aggregated value depends from geometric mean of MSE's of each frames, Total PSNR depends on arithmetic mean of them.
In MSU VQMT you can calculate PSNR for all YUV and RGB components and for L component of LUV color space. Also, since VQMT 12 you can calculate over all YUV space or all RGB space, achieving a single value for 3 components. PSNR metric is easy and fast to calculate, but sometimes it is not appropriate to human's perception.
Benchmark
| Implementation |
System & settings |
Resulution |
FPS |
Sec. per frame |
| VQMT 13 default-Y |
8 cores |
HD 720p |
492.737 |
0.002 |
| VQMT 13 default-Y |
1 core enabled |
HD 720p |
477.477 |
0.002 |
| VQMT 13 default-Y |
8 cores |
FullHD 1080p |
213.148 |
0.005 |
| VQMT 13 default-Y |
1 core enabled |
FullHD 1080p |
213.664 |
0.005 |
| VQMT 13 default-Y |
8 cores |
UHD 4k 2160p |
48.946 |
0.020 |
| VQMT 13 default-Y |
1 core enabled |
UHD 4k 2160p |
50.437 |
0.020 |
| VQMT 13 default-YUV |
8 cores |
HD 720p |
365.428 |
0.003 |
| VQMT 13 default-YUV |
1 core enabled |
HD 720p |
276.738 |
0.004 |
| VQMT 13 default-YUV |
8 cores |
FullHD 1080p |
161.647 |
0.006 |
| VQMT 13 default-YUV |
1 core enabled |
FullHD 1080p |
134.382 |
0.007 |
| VQMT 13 default-YUV |
8 cores |
UHD 4k 2160p |
37.379 |
0.027 |
| VQMT 13 default-YUV |
1 core enabled |
UHD 4k 2160p |
33.964 |
0.029 |
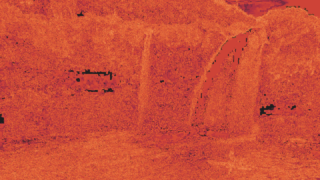
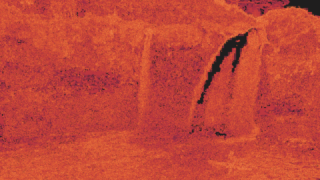
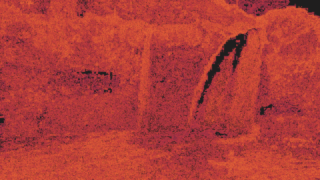
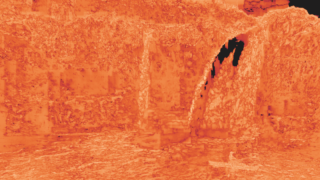
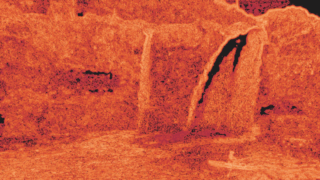
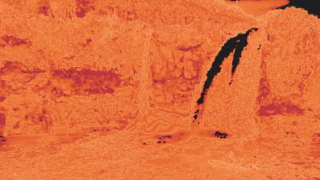
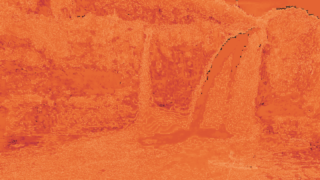
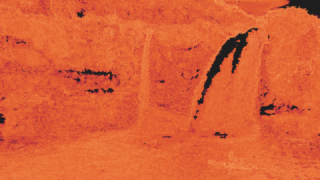
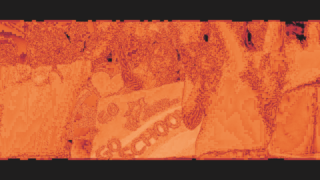
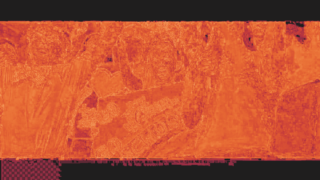
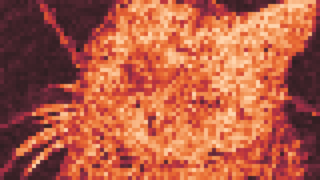
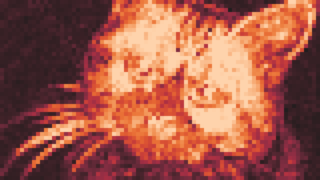
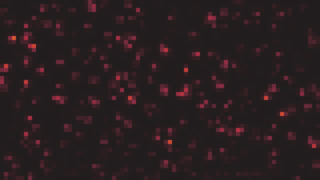
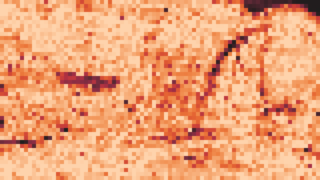
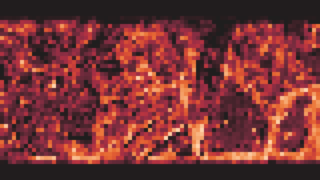
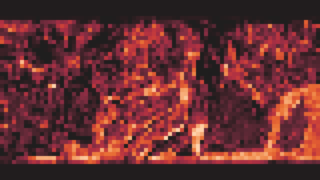
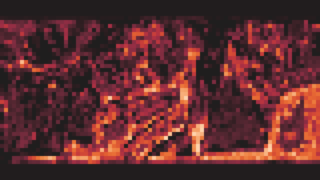
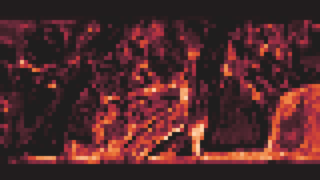
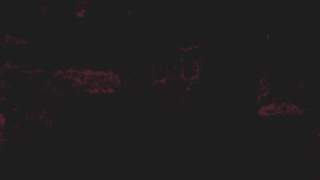
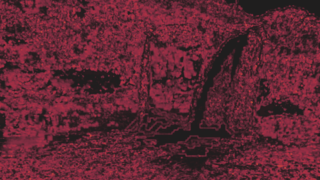
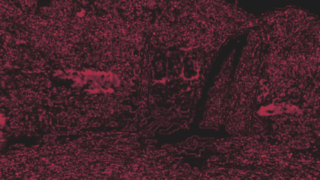
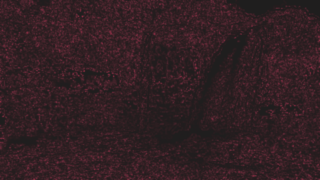
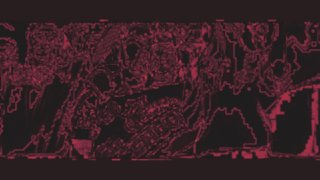
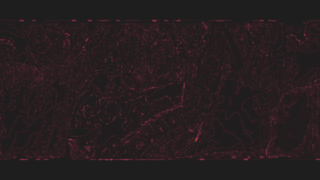
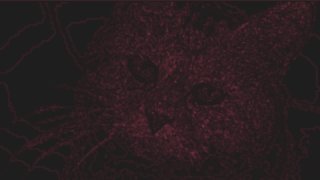
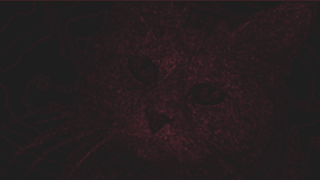
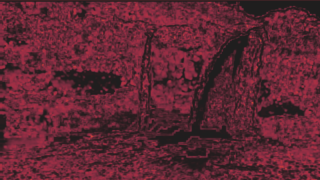
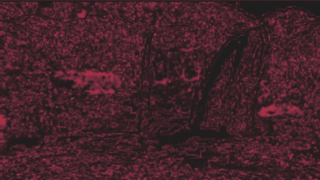
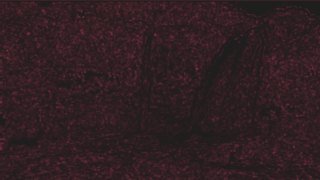
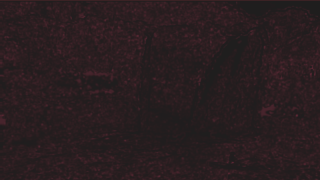
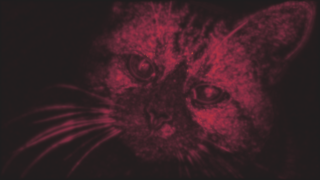
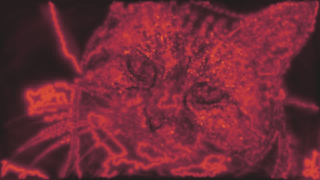
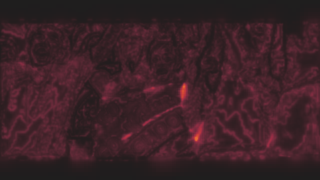
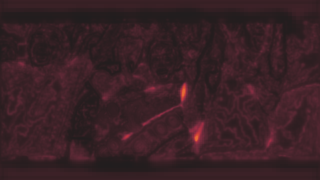
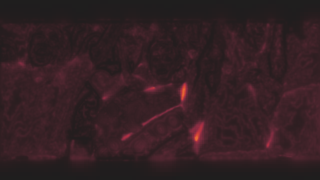
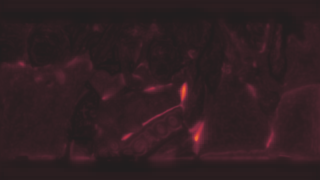
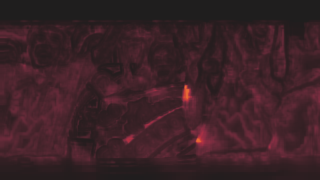
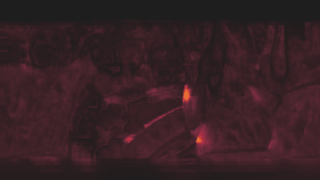
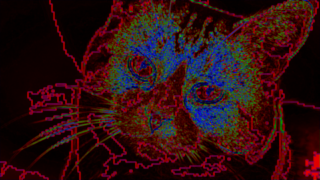
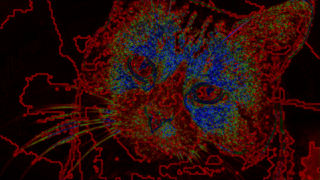
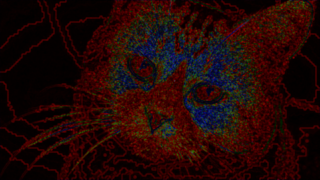
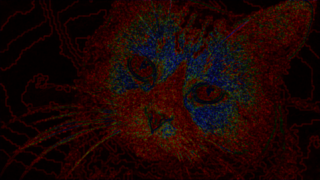
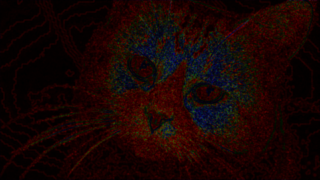
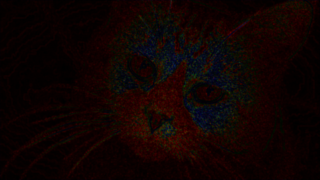
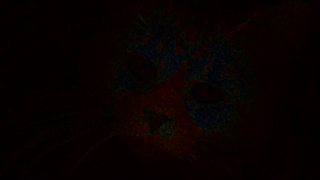
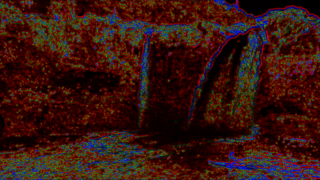
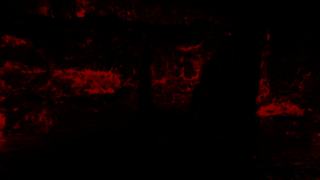
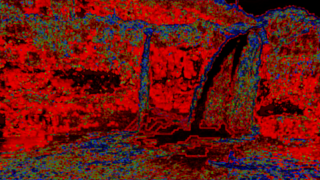
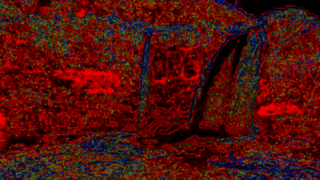
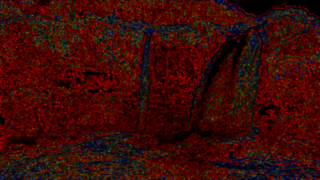
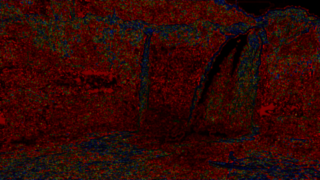
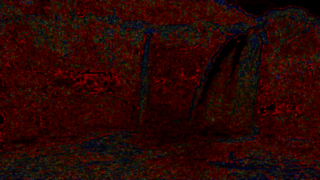
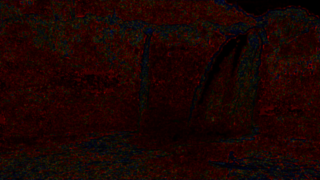
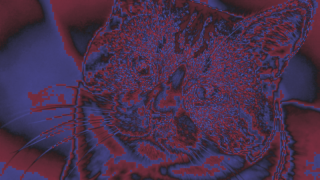
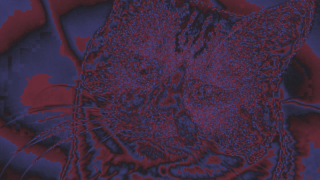
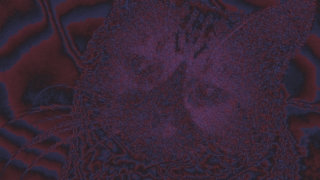
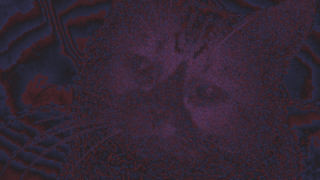
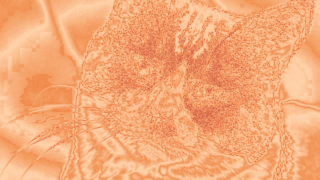
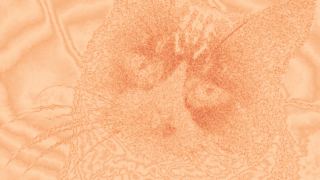
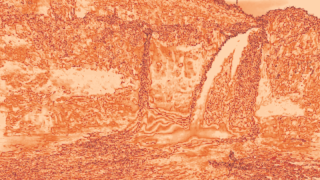
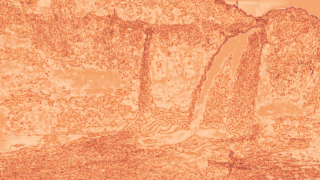
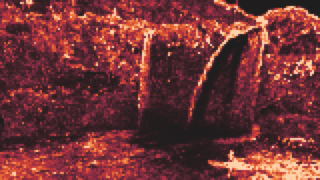
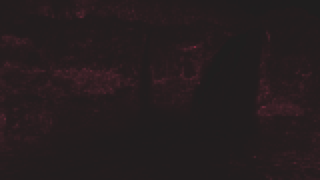
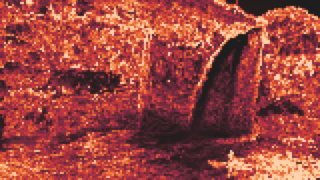
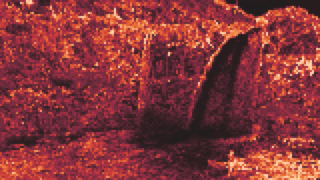
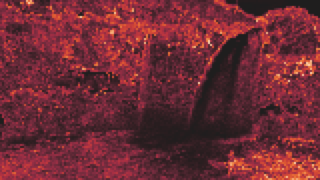
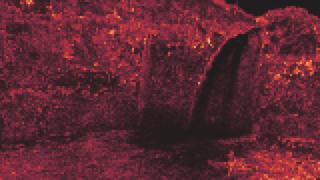
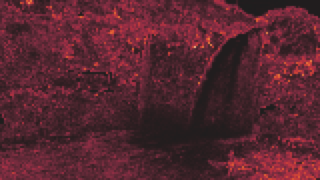
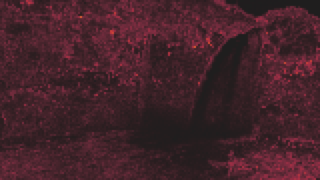
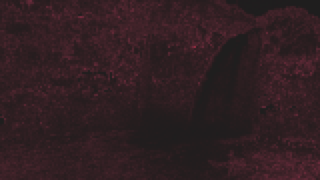
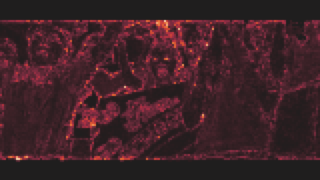
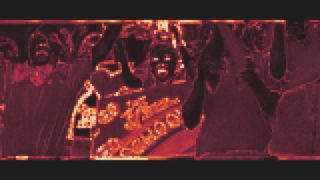
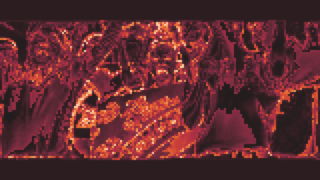
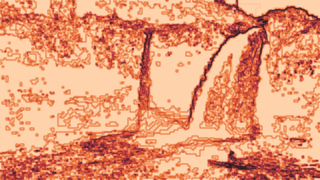
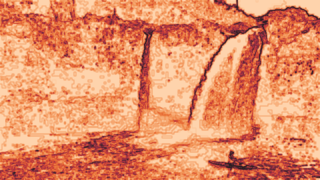
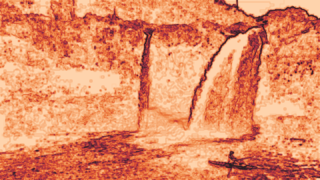
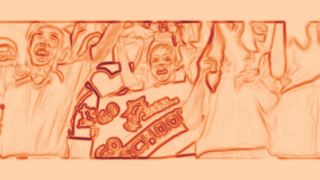
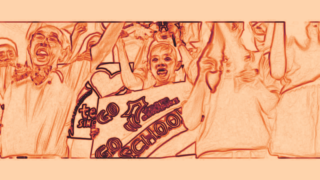
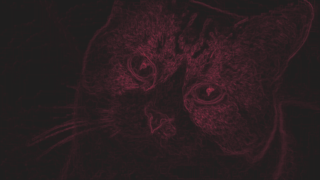
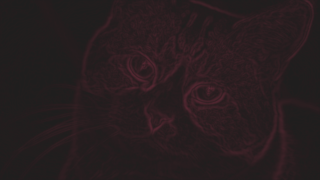
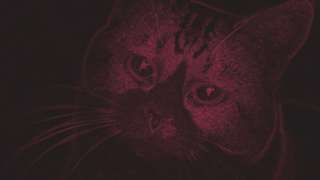
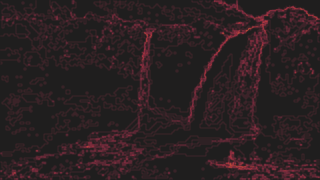
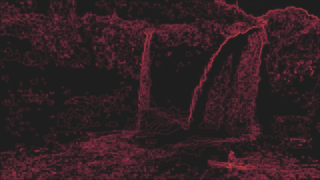
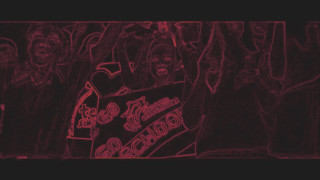
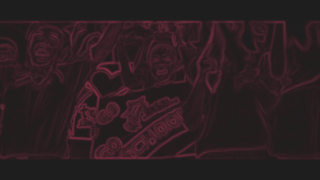
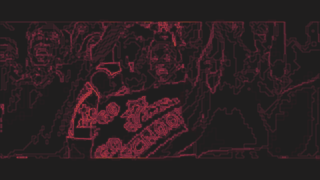
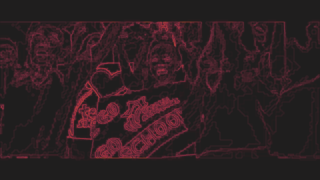
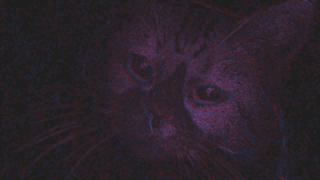
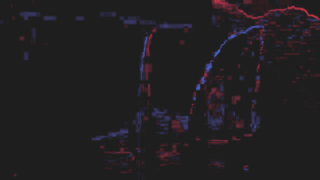
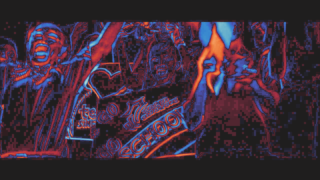
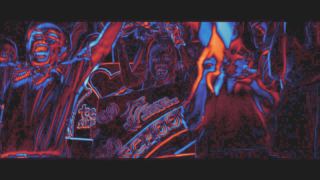
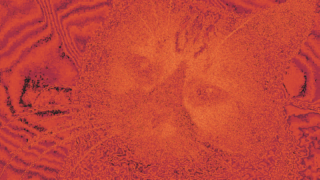
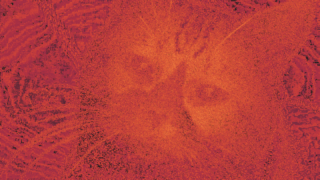
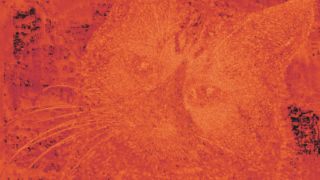
Example
Legacy notes
Video Multimethod Assessment Fusion (Netflix VMAF)
General info
- Metric type:
- full-reference
temporal
metric
- Value range:
- (completely different) 0..100 (similar to original)
-∞..∞ if truncation to 0..100 is off
dependent on model in case of custom model
- Value interpretation:
- bigger better quality, value 100 does not mean that the images match pixel by pixel
- MSU VQMT implementations:
- CPU multithreaded
OpenCL
(since VQMT 13)
- MSU VQMT visualization:
- block-wise (for VMAF visualization),
pixel-wise (for ADM, VIF, ANSNR visualisation)
- Available colorspaces:
- Y
- Output values:
- metric value,
bagging values (if on),
confidence intervals (if on),
values of elementary features (if on)
- Aggregated values:
- standard set
- MSU VQMT usages:
-metr vmaf [-dev <OpenCL device>]- External links:
- Original paper
Algorithm description
VMAF is modern reference metric developed by Netflix in cooperation with the University of Southern California. VQMT has full support of VMAF with multiple configuration switches. MSU VQMT support the following VMAF models: VMAF 0.60, VMAF 0.61 (2k, 4k), VMAF 0.62 (2k, 4k), VMAF 0.63 (2k), also, you can compute phone model and elementary features of VMAF. You can use custom model in pkl format with VQMT.
VMAF consist of 4 features (ADM, VIF, Motion, ANSNR) and 35 elementary features, but VMAF models uses only 6 of them: adm2, motion2, vif_scale0, vif_scale1, vif_scale2, vif_scale3. VMAF applies an SVM model to this set of features, which depends on current settings. After applying SVM, the value is clipped to interval 0..100 by default. Motion feature is the only temporal feature, it consider adjacent frames. To calculate VMAF value for current frame it is needed to use the previous frame and the next frame.
VMAF can also compute confidence intervals by applying multiple models and calculating standard deviation of result. VMAF has models, that aimed for 4k and 2k. By default, VQMT will automatically select the correct model by the resolution of input video.
Since VQMT 13 VMAF has a real block-wise visualization, which computes individual VMAF value for each 16x16 block of image. You also can visualize every feature besides motion (ADM, VIF, ANSNR).
MSU VQMT parameters description
Model preset
- Description. Choose built-in model or 'custom' for loading model from file. Built-in models:
- default - VMAF default behaviour:
- VMAF v0.6.1 for running without confidence interval and per-model values
- VMAF v0.6.1 4k for previous case if applying 4k model
- VMAF v0.6.3 for running with confidence interval or per-model values
- VMAF v0.6.2 4k for previous case if applying 4k model (NOTE: no v0.6.3 for 4k)
- vmaf_v061 - Netflix model VMAF v0.6.1 (2k or 4k)
- vmaf_v062 - Netflix model VMAF v0.6.2 (2k or 4k), supports confidence interval
- vmaf_v063 - Netflix model VMAF v0.6.3 (only 2k), supports confidence interval
- all_models - vmaf_v061 - vmaf_v063 computed sumultaneously
- basic_features - view only basic features from VMAF. Model will not be applied
- standard_features - features that is used in VMAF v0.6.1 and VMAF score (2k or 4k)
- all_features - view all features from VMAF. Model will not be applied
- all - all feature and next models:
- VMAF v0.6.1 (2k or 4k)
- VMAF v0.6.2 (2k or 4k)
- VMAF v0.6.3
- Default value. default
- Usage.
-set "model_preset=<value>", where <value> can be:
default, vmaf_v061, vmaf_v062, vmaf_v063, vmaf_v060, all_models, basic_features, standard_features, all_features, all, custom.
Custom model (*.pkl)
- Description. You can specify path to
*.pkl file here (or multiple ;-separated *.pkl files). Model file should be placed near pkl file.
NOTE: this only means if preset is set to 'custom'
- Default value. empty
- Usage.
-set "custom_model_files=<value>", where <value> can be:
any string.
4k
Confidence interval
- Description. Turn on additional VMAF features: 95%-confidence interval output and other statistical information
- Default value. false
- Usage.
-set "confidence_interval=<value>", where <value> can be:
true, false
Per-model values
- Description. Output values for all bootstrap models if confidence interval is on
- Default value. false
- Usage.
-set "permodel_values=<value>", where <value> can be:
true, false
Visualize algorithm (if on)
- Description. If visualization turned on you can select feature to visualize. It's impossible to calculate distribution of real VMAF value, so you can only visualize one of supposed features
- Default value. default
- Usage.
-set "visualize_alg=<value>", where <value> can be:
default, adm, ansnr, vif
Use phone model
- Description. Turn on postprocessing of metric value that produces more precise results for handheld devices. Select 'both' to see both results with and without postprocessing
- Default value. no
- Usage.
-set "phone_model=<value>", where <value> can be:
no, yes, both
Disable clipping values
- Description. Turn off clipping value to range set by model (0..100 for example)
- Default value. false
- Usage.
-set "disable_clip=<value>", where <value> can be:
true, false
Benchmark
| Implementation |
System & settings |
Resulution |
FPS |
Sec. per frame |
| VQMT 13 default-Y |
8 cores |
HD 720p |
492.737 |
0.002 |
| VQMT 13 default-Y |
1 core enabled |
HD 720p |
477.477 |
0.002 |
| VQMT 13 default-Y |
8 cores |
FullHD 1080p |
213.148 |
0.005 |
| VQMT 13 default-Y |
1 core enabled |
FullHD 1080p |
213.664 |
0.005 |
| VQMT 13 default-Y |
8 cores |
UHD 4k 2160p |
48.946 |
0.020 |
| VQMT 13 default-Y |
1 core enabled |
UHD 4k 2160p |
50.437 |
0.020 |
| VQMT 13 default-YUV |
8 cores |
HD 720p |
365.428 |
0.003 |
| VQMT 13 default-YUV |
1 core enabled |
HD 720p |
276.738 |
0.004 |
| VQMT 13 default-YUV |
8 cores |
FullHD 1080p |
161.647 |
0.006 |
| VQMT 13 default-YUV |
1 core enabled |
FullHD 1080p |
134.382 |
0.007 |
| VQMT 13 default-YUV |
8 cores |
UHD 4k 2160p |
37.379 |
0.027 |
| VQMT 13 default-YUV |
1 core enabled |
UHD 4k 2160p |
33.964 |
0.029 |
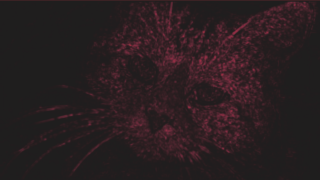
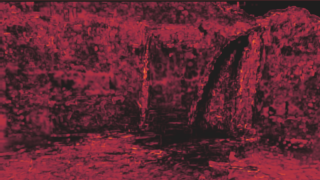
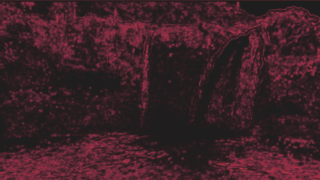
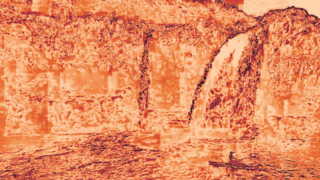
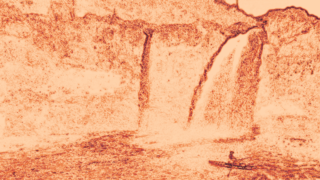
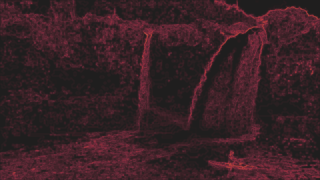
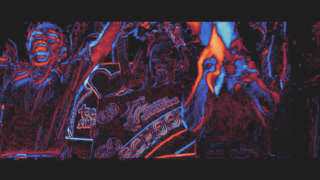
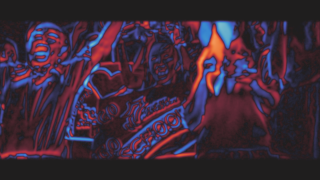
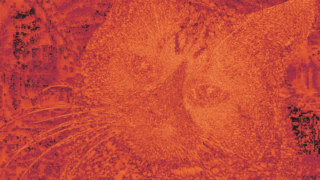
Example
Naturalness Image Quality Evaluator (NIQE)
General info
- Metric type
- no-reference
image
metric
- Value range
- (very natural) 0..∞ (not natural)
- Value interpretation
- bigger metric values - better quality (naturalness)
normal metric values are in range about 3..20. Also, there can be values NAN and 0, which are abnormal and should be considered as symptom of not natural image
- MSU VQMT implementations
- CPU multithreaded
OpenCL
(since VQMT 13)
- MSU VQMT visualization
- block-wise
- Available colorspaces
- Y
- Output values
- metric value
- Aggregated values
- standard set
, NIQE mean
- MSU VQMT usages
-metr niqe [-dev <OpenCL device>]- External links
- original paper (A. Mittal, R. Soundararajan and A. C. Bovik),
MSU paper
Algorithm description
NIQE performs feature extraction for every 96x96 block of image on 2 scales. Than it computes correlations of features between all blocks and applies leaned model. For more details, please refer to original paper. Since version 13 VQMT can build a block-wise visualization showing contribution of each block to the final result.
This metric has a special aggregated value NIQE mean, it takes a weighted mean filtering abnormal metric values and taking suspicies values with low weight. You can turn this mode using metric settings. Also, please see our paper.
This metric only applicable to filmed scenes. Metric can produce inadequate result if some graphics is on it (including credits, subtitles, etc.). Please, run NIQE excluding all rendered scenes, they can fatally spoil average value. Also, this metric can produce bad result on scenes containing noisy objects, like sand or grass, however on scenes with big constant areas, like monotonic sky. In common case normal metric results lies in the interval 3..20.
Sometimes, metric shows better result for the compressed image and this correlates with human perception. Compressed image not always is perceived as worse. It can occur for example in case of noisy images (if the noise has non-compression nature). This is only metric in VQMT now that can detect increasing of subjective quality in comparison to original.
Sometimes, codec can allow geometry transformation (like shift of heterogeneous objects in frame), that not critical for subjective perception. Objective-reference metrics are very perceptive to such transformation, and in this cases no-reference metric can show result closer to subjective score.
Benchmark
| Implementation |
System & settings |
Resulution |
FPS |
Sec. per frame |
| VQMT 13 OpenCL-Y |
NVidia GeForce GTX 660 Ti |
HD 720p |
92.981 |
0.011 |
| VQMT 13 OpenCL-Y |
NVidia GeForce GTX 660 Ti |
FullHD 1080p |
41.738 |
0.024 |
| VQMT 13 OpenCL-Y |
NVidia GeForce GTX 660 Ti |
UHD 4k 2160p |
10.481 |
0.095 |
| VQMT 13 default-Y |
8 cores |
HD 720p |
43.979 |
0.023 |
| VQMT 13 default-Y |
1 core enabled |
HD 720p |
10.670 |
0.094 |
| VQMT 13 default-Y |
8 cores |
FullHD 1080p |
19.645 |
0.051 |
| VQMT 13 default-Y |
1 core enabled |
FullHD 1080p |
4.573 |
0.219 |
| VQMT 13 default-Y |
8 cores |
UHD 4k 2160p |
4.808 |
0.208 |
| VQMT 13 default-Y |
1 core enabled |
UHD 4k 2160p |
1.136 |
0.880 |
MSU VQMT parameters description
Mean threshold
- Description. Values of metric greater than this value will be skipped during mean calculation. 0 for disable skipping
- Default value. 15.
- Usage.
-set "mean_thresh=<value>", where <value> can be:
any floating point number
Threshold smoothing
- Description. Values of metric greater than 'Mean threshold' + 'Threshold smoothing' will be skipped, values less than 'Mean threshold' - 'Threshold smoothing' will be assumed with weight 1. Intermediate values will be taken with intermediate weight
- Default value.
5.
- Usage.
-set "mean_thresh_smoothing=<value>", where <value> can be:
any floating point number
Type of normalization
- Description. Can be: fast - the fastest algorithm, low precision; native - like in native NIQE implementation. Slowest one; precise - the most precise algorithm
- Default value. native
- Usage.
-set "norm_alg=<value>", where <value> can be:
fast, native, precise
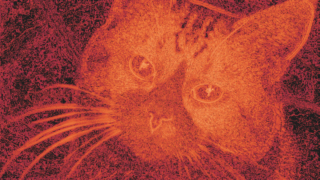
Example
SSIM-family
Structural Similarity (SSIM)
General info
- Metric type:
- full-reference
image
metric
- Value range:
- (images are different) -1..1 (images are same)
- Value interpretation:
- bigger is better quality
- MSU VQMT implementations:
- CPU multithreaded
fast (default),
cpu multithreaded precice,
cpu multithreaded GPU identical,
OpenCL
(recommended),
CUDA
- MSU VQMT visualization:
- pixel-wise
- Available colorspaces:
- Y, U, V
- Output values:
- metric value
- Aggregated values:
- standard set
- MSU VQMT usages:
-metr ssim [over <color components>]
-metr ssim_precise [over <color components>]
-metr ssim_gpu_id [over <color components>]
-metr ssim_cuda [over <color components>]
-metr ssim [over <color components>] -dev <OpenCL device>- External links:
- original paper (Z. Wang, A. C. Bovik, H. R. Sheikh and E. P. Simoncelli)
Algorithm description
Main idea of the structure similarity index (SSIM) is to compare distortion of three image components:
- Luminance comparison
- Contrast comparison
- Structure comparison
This algorithm uses some window function , and performs convolution with this window, defined as follows:
In fast implementation, it uses box window: , in other implementations (precise, CUDA, OpenCL, GPU identical) it uses Gaussian window with σ= 1.5, N=10. You can note, that formula above uses negative indexes, and indexes out of image area. We should define image values outside of it's edge. In VQMT we spread closest edge pixel to the desired position.
SSIM uses the following convolutions:
And the computed SSIM in each pixel by the following formula:
where , . Destination metric value is arithmetic mean of SSIM values for each pixel. You also can see SSIM for each individual pixel on visualization.
GPU identical, CUDA, OpenCL implementations should produce very similar result. They use Gaussian window as presice implementation. Value of Presice implementation can differs from these ones.
Benchmark
| Implementation |
System & settings |
Resulution |
FPS |
Sec. per frame |
| VQMT 13 OpenCL-Y |
NVidia GeForce GTX 660 Ti |
HD 720p |
356.442 |
0.003 |
| VQMT 13 OpenCL-Y |
NVidia GeForce GTX 660 Ti |
FullHD 1080p |
162.801 |
0.006 |
| VQMT 13 OpenCL-Y |
NVidia GeForce GTX 660 Ti |
UHD 4k 2160p |
42.519 |
0.024 |
| VQMT 13 Fast-Y |
8 cores |
HD 720p |
228.253 |
0.004 |
| VQMT 13 Fast-Y |
1 core enabled |
HD 720p |
80.533 |
0.012 |
| VQMT 13 Fast-Y |
8 cores |
FullHD 1080p |
99.314 |
0.010 |
| VQMT 13 Fast-Y |
1 core enabled |
FullHD 1080p |
36.313 |
0.028 |
| VQMT 13 Fast-Y |
8 cores |
UHD 4k 2160p |
21.397 |
0.047 |
| VQMT 13 Fast-Y |
1 core enabled |
UHD 4k 2160p |
9.369 |
0.107 |
| VQMT 13 Precise-Y |
8 cores |
HD 720p |
100.199 |
0.010 |
| VQMT 13 Precise-Y |
1 core enabled |
HD 720p |
49.398 |
0.020 |
| VQMT 13 Precise-Y |
8 cores |
FullHD 1080p |
44.808 |
0.022 |
| VQMT 13 Precise-Y |
1 core enabled |
FullHD 1080p |
22.163 |
0.045 |
| VQMT 13 Precise-Y |
8 cores |
UHD 4k 2160p |
10.704 |
0.093 |
| VQMT 13 Precise-Y |
1 core enabled |
UHD 4k 2160p |
5.640 |
0.177 |
Example (SSIM Precise)
Example (SSIM Fast)
Multi-Scale Structural Similarity (MSSSIM)
General info
- Metric type:
- full-reference
image
metric
- Value range:
- (images are different) -1..1 (images are same)
- Value interpretation:
- bigger is better quality
- MSU VQMT implementations:
- CPU multithreaded
fast (default),
cpu multithreaded precice,
cpu multithreaded GPU identical,
OpenCL
(recommended),
CUDA
- MSU VQMT visualization:
- pixel-wise
- Available colorspaces:
- Y, U, V
- Output values:
- metric value
- Aggregated values:
- standard set
- MSU VQMT usages:
-metr msssim [over <color components>]
-metr msssim_precise [over <color components>]
-metr msssim_gpu_id [over <color components>]
-metr msssim_cuda [over <color components>]
-metr msssim [over <color components>] -dev <OpenCL device>- Other names:
- MS-SSIM
- External links:
- original paper (Z. Wang, A. C. Bovik and E. P. Simoncelli)
Algorithm description
This metric performs SSIM calculation as described in SSIM paragraph for 5 scales of input images. Each next scale divides width and height by 2. The result SSIM values are producted with the following powers: 0.0448, 0.2856, 0.3001, 0.2363, 0.1333.
Benchmark
| Implementation |
System & settings |
Resulution |
FPS |
Sec. per frame |
| VQMT 13 OpenCL-Y |
NVidia GeForce GTX 660 Ti |
HD 720p |
292.609 |
0.003 |
| VQMT 13 OpenCL-Y |
NVidia GeForce GTX 660 Ti |
FullHD 1080p |
153.978 |
0.006 |
| VQMT 13 OpenCL-Y |
NVidia GeForce GTX 660 Ti |
UHD 4k 2160p |
41.315 |
0.024 |
| VQMT 13 Fast-Y |
8 cores |
HD 720p |
140.919 |
0.007 |
| VQMT 13 Fast-Y |
1 core enabled |
HD 720p |
59.057 |
0.017 |
| VQMT 13 Fast-Y |
8 cores |
FullHD 1080p |
62.080 |
0.016 |
| VQMT 13 Fast-Y |
1 core enabled |
FullHD 1080p |
26.435 |
0.038 |
| VQMT 13 Fast-Y |
8 cores |
UHD 4k 2160p |
13.583 |
0.074 |
| VQMT 13 Fast-Y |
1 core enabled |
UHD 4k 2160p |
6.681 |
0.150 |
| VQMT 13 Precise-Y |
8 cores |
HD 720p |
60.840 |
0.016 |
| VQMT 13 Precise-Y |
1 core enabled |
HD 720p |
28.119 |
0.036 |
| VQMT 13 Precise-Y |
8 cores |
FullHD 1080p |
27.262 |
0.037 |
| VQMT 13 Precise-Y |
1 core enabled |
FullHD 1080p |
12.176 |
0.082 |
| VQMT 13 Precise-Y |
8 cores |
UHD 4k 2160p |
6.669 |
0.150 |
| VQMT 13 Precise-Y |
1 core enabled |
UHD 4k 2160p |
3.132 |
0.319 |
Example (MSSSIM Precise)
Example (MSSSIM Fast)
Three-commponent Structural Similarity (3SSIM)
General info
- Metric type:
- full-reference
image
metric
- Value range:
- (images are different) -1..1 (images are same)
- Value interpretation:
- bigger is better quality
- MSU VQMT implementations:
- CPU multithreaded
(default),
OpenCL
(recommended),
CUDA
- Available colorspaces:
- Y, U, V
- Output values:
- metric value
- Aggregated values:
- standard set
- MSU VQMT usages:
-metr 3ssim [over <color components>]
-metr 3ssim_cuda [over <color components>]
-metr 3ssim [over <color components>] -dev <OpenCL device>- Other names:
- 3-SSIM
- External links:
- original paper (C. Li and A. C. Bovik)
Algorithm description
3-Component SSIM Index based on region division of source frames. There are 3 types of regions - edges, textures and smooth regions. Result metric calculated as weighted average of SSIM metric for those regions. In fact, human eye can see difference more precisely on textured or edge regions than on smooth regions. Division based on gradient magnitude is presented in every pixel of images.
Benchmark
| Implementation |
System & settings |
Resulution |
FPS |
Sec. per frame |
| VQMT 13 OpenCL-Y |
NVidia GeForce GTX 660 Ti |
HD 720p |
81.189 |
0.012 |
| VQMT 13 OpenCL-Y |
NVidia GeForce GTX 660 Ti |
FullHD 1080p |
86.813 |
0.012 |
| VQMT 13 OpenCL-Y |
NVidia GeForce GTX 660 Ti |
UHD 4k 2160p |
9.364 |
0.107 |
| VQMT 13 default-Y |
8 cores |
HD 720p |
52.110 |
0.019 |
| VQMT 13 default-Y |
1 core enabled |
HD 720p |
30.669 |
0.033 |
| VQMT 13 default-Y |
8 cores |
FullHD 1080p |
23.131 |
0.043 |
| VQMT 13 default-Y |
1 core enabled |
FullHD 1080p |
13.018 |
0.077 |
| VQMT 13 default-Y |
8 cores |
UHD 4k 2160p |
5.698 |
0.176 |
| VQMT 13 default-Y |
1 core enabled |
UHD 4k 2160p |
3.350 |
0.299 |
Example
Spatio-Temporal SSIM Index
General info
- Metric type:
- full-reference
temporal
metric
- MSU VQMT implementations:
- this metric was temporary excluded from VQMT due to unstability of results
- External links:
- original paper (A. K. Moorthy and A. C. Bovik)
Algorithm description
The idea of this algorithm is to use motion-oriented weighted windows for SSIM Index. MSU Motion Estimation algorithm is used to retrieve this information. Based on the ME results, weighting window is constructed for every pixel. This window can use up to 33 consecutive frames (16 + current frame + 16). Then SSIM Index is calculated for every window to take into account temporal distortions as well. In addition, another spooling technique is used in this implementation. We use only lower 6% of metric values for the frame to calculate frame metric value. This causes larger metric values difference for difference files.
Legacy notes
This metric was temporary removed in VQMT 10.
Norm calculation metrics
Identity
General info
- Metric type:
- full-reference
image
metric
- Value range:
- (images are different) 0..1 (images are same)
- Value interpretation:
- binary mode: 1 - images are same, 0 - images are not same;
pixel mode: proportion of same pixels
- MSU VQMT implementations:
- CPU multithreaded
- MSU VQMT visualization:
- pixel-wise
- Available colorspaces:
- R, G, B, Y, U, V, L, RGB, YUV
- Output values:
- metric value
- Aggregated values:
- standard set
- MSU VQMT usages:
-metr identity [over <color components>]- Other names:
- inverse L∞-norm
Algorithm description
Metric cas to modes: binary and pixels. In binary mode only two values are possible: 1 if images are pixel-wise similar, 0 if images have at least 1 different value pixel.
In pixel mode the value is proporsion of similar pixels. 1 means all pixels are similar, 0 means all pixels are dirrefent.
MSU VQMT parameters description
Mode
- Description. In binary mode only two values are possible: 1 if images are pixel-wise similar, 0 if images have at least 1 different value pixel. In pixel mode the value is proporsion of similar pixels. 1 means all pixels are similar, 0 means all pixels are dirrefent.
- Default value. binary
- Usage.
-set "mode=<value>", where <value> can be:
binary, pixels
Benchmark
| Implementation |
System & settings |
Resulution |
FPS |
Sec. per frame |
| VQMT 13 default-Y |
8 cores |
HD 720p |
476.267 |
0.002 |
| VQMT 13 default-Y |
1 core enabled |
HD 720p |
517.130 |
0.002 |
| VQMT 13 default-Y |
8 cores |
FullHD 1080p |
236.593 |
0.004 |
| VQMT 13 default-Y |
1 core enabled |
FullHD 1080p |
236.156 |
0.004 |
| VQMT 13 default-Y |
8 cores |
UHD 4k 2160p |
53.023 |
0.019 |
| VQMT 13 default-Y |
1 core enabled |
UHD 4k 2160p |
53.498 |
0.019 |
| VQMT 13 default-YUV |
8 cores |
HD 720p |
425.065 |
0.002 |
| VQMT 13 default-YUV |
1 core enabled |
HD 720p |
328.717 |
0.003 |
| VQMT 13 default-YUV |
8 cores |
FullHD 1080p |
189.175 |
0.005 |
| VQMT 13 default-YUV |
1 core enabled |
FullHD 1080p |
161.241 |
0.006 |
| VQMT 13 default-YUV |
8 cores |
UHD 4k 2160p |
42.603 |
0.023 |
| VQMT 13 default-YUV |
1 core enabled |
UHD 4k 2160p |
39.692 |
0.025 |
Example
Legacy notes
This metric was introduce in VQMT 13.
Delta
General info
- Metric type:
- full-reference
image
metric
- Value range:
- (original is much brigther) -1..1 (distorted is much brigther)
- Value interpretation:
- bigger is darker original, 0 - same brightness
- MSU VQMT implementations:
- CPU multithreaded
- MSU VQMT visualization:
- pixel-wise
- Available colorspaces:
- R, G, B, Y, U, V, L
- Output values:
- metric value
- Aggregated values:
- standard set
- MSU VQMT usages:
-metr delta [over <color components>]- Other names:
- mean difference
Algorithm description
The value of this metric is the mean difference of the color value in the corresponding points of image.
where - video width, - video height, image data are in range 0..1. This formula can be rewriten to the following way: .
This metric doesn't show a quality loss, because it can be 0 for completely different images, but you can detect general brightness shifts using this metric if you are sure images have same structure.
Benchmark
| Implementation |
System & settings |
Resulution |
FPS |
Sec. per frame |
| VQMT 13 default-Y |
8 cores |
HD 720p |
512.883 |
0.002 |
| VQMT 13 default-Y |
1 core enabled |
HD 720p |
495.231 |
0.002 |
| VQMT 13 default-Y |
8 cores |
FullHD 1080p |
221.637 |
0.005 |
| VQMT 13 default-Y |
1 core enabled |
FullHD 1080p |
225.761 |
0.004 |
| VQMT 13 default-Y |
8 cores |
UHD 4k 2160p |
50.758 |
0.020 |
| VQMT 13 default-Y |
1 core enabled |
UHD 4k 2160p |
51.687 |
0.019 |
Example
Legacy notes
Since VQMT 12 metric uses input range 0..1. In legacy mode is assumed input range to be 0..255 and 0..100 for L channel.
Mean Sum of Absolute Differences (MSAD)
General info
- Metric type:
- full-reference
image
metric
- Value range:
- (same images) 0..1 (completely different)
- Value interpretation:
- smaller is better quality
- MSU VQMT implementations:
- CPU multithreaded
- MSU VQMT visualization:
- pixel-wise
- Available colorspaces:
- R, G, B, Y, U, V, L
- Output values:
- metric value
- Aggregated values:
- standard set
- MSU VQMT usages:
-metr msad [over <color components>]- Other names:
- SAD, -norm
- External links:
- Wikipedia
Algorithm description
This metric has very similar formula to Delta, but has a modulo around the difference:
where - video width, - video height, image data are in range 0..1. Metric depends only on difference of original and distorted, it is -norm of this difference.
Unlike Delta, this metric will show real difference between images, 0 means completely equivalent images.
Benchmark
| Implementation |
System & settings |
Resulution |
FPS |
Sec. per frame |
| VQMT 13 default-Y |
8 cores |
HD 720p |
511.594 |
0.002 |
| VQMT 13 default-Y |
1 core enabled |
HD 720p |
497.523 |
0.002 |
| VQMT 13 default-Y |
8 cores |
FullHD 1080p |
224.310 |
0.004 |
| VQMT 13 default-Y |
1 core enabled |
FullHD 1080p |
225.746 |
0.004 |
| VQMT 13 default-Y |
8 cores |
UHD 4k 2160p |
50.950 |
0.020 |
| VQMT 13 default-Y |
1 core enabled |
UHD 4k 2160p |
51.451 |
0.019 |
Example
Legacy notes
Since VQMT 12 metric uses input range 0..1. In legacy mode is assumed input range to be 0..255 and 0..100 for L channel.
Mean Squared Error (MSE)
General info
- Metric type:
- full-reference
image
metric
- Value range:
- (same images) 0..1 (completely different)
- Value interpretation:
- smaller is better quality
- MSU VQMT implementations:
- CPU multithreaded
- MSU VQMT visualization:
- pixel-wise
- Available colorspaces:
- R, G, B, Y, U, V, L
- Output values:
- metric value
- Aggregated values:
- standard set
- MSU VQMT usages:
-metr mse [over <color components>]- Other names:
- -norm
- External links:
- Wikipedia
Algorithm description
Metric depends only on difference of original and distorted, it is L2-norm of this difference. Metric could be computed using the following formula:
where - video width, - video height, image data are in range 0..1.
Benchmark
| Implementation |
System & settings |
Resulution |
FPS |
Sec. per frame |
| VQMT 13 default-Y |
8 cores |
HD 720p |
511.686 |
0.002 |
| VQMT 13 default-Y |
1 core enabled |
HD 720p |
494.866 |
0.002 |
| VQMT 13 default-Y |
8 cores |
FullHD 1080p |
224.004 |
0.004 |
| VQMT 13 default-Y |
1 core enabled |
FullHD 1080p |
225.775 |
0.004 |
| VQMT 13 default-Y |
8 cores |
UHD 4k 2160p |
51.577 |
0.019 |
| VQMT 13 default-Y |
1 core enabled |
UHD 4k 2160p |
49.594 |
0.020 |
Example
Legacy notes
Since VQMT 12 metric uses input range 0..1. In legacy mode is assumed input range to be 0..255 and 0..100 for L channel.
Other metrics
DCT-based Video Quality Metric (VQM)
General info
- Metric type:
- full-reference
image
metric
- Value range:
- (images are same) 0..∞ (bad quality)
- Value interpretation:
- smaller is better quality
- MSU VQMT implementations:
- CPU multithreaded
- MSU VQMT visualization:
- pixel-wise
- Available colorspaces:
- Y
- Output values:
- metric value
- Aggregated values:
- standard set
- MSU VQMT usages:
-metr vqm- External links:
- original paper (Feng Xiao)
Algorithm description
This metric uses discrete cosine transform (DCT) to predict human rank. It is different from widely spreaded VQM metric by ITU, that currently not implemented in VQMT. Following calculations are processed to get value of metric:
- Color transform. YUV color space is used for metric calculation.
- DCT transform of blocks 8x8. It is used to separate images into different frequencies.
- Conversion from DCT coefficients to local contrast (LC) using following equation:
where DC is the DCT coefficient with indexes (0, 0).
- Conversion from LC to just-noticeable difference:
where CSF is Contrast Sensitivity Function. Inverse MPEG-4 default quantization matrix is used as CSF in original article.
- Weighted pooling of mean and maximum distortions. First, absolute difference D is calculated for JND coefficients following by VQM value construction:
Please, refer the original paper for the details.
Benchmark
| Implementation |
System & settings |
Resulution |
FPS |
Sec. per frame |
| VQMT 13 default-Y |
8 cores |
HD 720p |
103.883 |
0.010 |
| VQMT 13 default-Y |
1 core enabled |
HD 720p |
24.360 |
0.041 |
| VQMT 13 default-Y |
8 cores |
FullHD 1080p |
47.902 |
0.021 |
| VQMT 13 default-Y |
1 core enabled |
FullHD 1080p |
11.205 |
0.089 |
| VQMT 13 default-Y |
8 cores |
UHD 4k 2160p |
12.045 |
0.083 |
| VQMT 13 default-Y |
1 core enabled |
UHD 4k 2160p |
2.848 |
0.351 |
Example
Legacy notes
In VQMT 12 we removed input aligning, also metric is optimized.
MSU Time shift
General info
- Metric type:
- full-reference
temporal
metric
- Value range:
- depending on settings
- Value interpretation:
- Metric value is shift in frames of distorted sequence relative to original. If n-th value is x, then n+x'th frame of distorted corresponds to n'th frame of original
- MSU VQMT implementations:
- CPU multithreaded
- MSU VQMT visualization:
- block-wise
- Available colorspaces:
- Y
- Output values:
- metric value
multiple individual measument results if on
- Aggregated values:
- standard set
- MSU VQMT usages:
-metr time-shift
Algorithm description
This metric performes calculation of another metric (base metric: PSNR or SSIM) between each frame of original image and several frames of distorted image. You can choose what interval will be used in settings. This metric can detect such artifacts as skipped frame, duplicated frame, small fps mismatch.
Metric considers, that the best metric value for specific original frame is the correct shift. Metric can prefer smaller shift with base metric value X to bigger shift with metric value Y if , where threshold can be set in metric settings. This helps to avoid random fluctuations.
Also, values of base metric will be smothed over adjacent frames if smoothing is on. This can help in case of very there are very similar adjacent frames in seuqence or the desired frame is absent (for example, negative shift on first frame).
MSU VQMT parameters description
Max. shift
- Description. Maximum shift, that can be detected. Note: large values leads big memory consumption.
- Default value. 5.
- Usage.
-set "max-shift=<value>", where <value> can be:
integer in range 0..25
Direction
- Description. Detect only positive shifts (frame dups), negatives (frame drops) or both.
- Default value. both
- Usage.
-set "direction=<value>", where <value> can be:
positive, negative, both
Destination metric
- Description. This metric will be used to measure similarity between frames
- Default value. psnr
- Usage.
-set "metric=<value>", where <value> can be:
psnr, ssim
Show metric values
- Description. Metric will output now only shift, but destination metric values
- Default value. false
- Usage.
-set "show-metric=<value>", where <value> can be:
true, false
Threshold
- Description. We will consider shift only if metric for neighbour frame better than this thresold multiplied to metric for similar frame
- Default value. false
- Usage.
-set "threshold=<value>", where <value> can be:
any floating point number
Smoothing
- Description. Will smooth metric values over time. If equal n, than smoothing will be in the interval frame-n..frame+n
- Default value. 1
- Usage.
-set "smoothing=<value>", where <value> can be:
integer in range 0..25
Benchmark
| Implementation |
System & settings |
Resulution |
FPS |
Sec. per frame |
| VQMT 13 default-Y |
8 cores |
HD 720p |
341.820 |
0.003 |
| VQMT 13 default-Y |
1 core enabled |
HD 720p |
276.412 |
0.004 |
| VQMT 13 default-Y |
8 cores |
FullHD 1080p |
125.327 |
0.008 |
| VQMT 13 default-Y |
1 core enabled |
FullHD 1080p |
98.154 |
0.010 |
| VQMT 13 default-Y |
8 cores |
UHD 4k 2160p |
30.121 |
0.033 |
| VQMT 13 default-Y |
1 core enabled |
UHD 4k 2160p |
24.025 |
0.042 |
Example
Legacy notes
This metric was introduced in VQMT 13.
MSU Blurring Metric
General info
- Metric type:
- no-reference
image
metric
- Value range:
- (constant image) 0..1 (very noisy)
- Value interpretation:
- bigger is more noise
- MSU VQMT implementations:
- CPU multithreaded
sigma (default),
CPU multithreaded
delta
- MSU VQMT visualization:
- pixel-wise
- Available colorspaces:
- Y, R, G, B for sigma
Y, U, V, R, G, B for delta
- Output values:
- metric value
- Aggregated values:
- standard set
- MSU VQMT usages:
-metr blurring [over <color components>]
-metr blurring_delta [over <color components>]
Algorithm description
This metric allows you to compare power of blurring of two images. If value of the metric for first picture is greater than for second, it means that second picture is more blurred, than first.
Main features: this metric is fast and doesn't require source video.
This method estimates color variance in the neighborhood of a pixel and computes average variance. This metric has 2 variations:
- Sigma (default since VQMT 11). It uses 3-pixel radius neighborhood and normalized Gaussian kernel
- Delta (the only before VQMT 11). It uses 1-pixel radius neighborhood
Notes:
- You can't measure blurriness on constant or gradient areas of input image. So, the value of metric is very dependent on amount of edges in images.
- This metric will detect not only compression artifacts, but natural not-infocus areas, so the value of metric is very dependent on area of focused objects in the frame. You shouldn't use value of this metric as final blurrness index, use is only to compare blurrness of images with similar structure.
Benchmark
| Implementation |
System & settings |
Resulution |
FPS |
Sec. per frame |
| VQMT 13 Delta-Y |
8 cores |
HD 720p |
1062.426 |
0.001 |
| VQMT 13 Delta-Y |
1 core enabled |
HD 720p |
998.102 |
0.001 |
| VQMT 13 Delta-Y |
8 cores |
FullHD 1080p |
451.868 |
0.002 |
| VQMT 13 Delta-Y |
1 core enabled |
FullHD 1080p |
449.640 |
0.002 |
| VQMT 13 Delta-Y |
8 cores |
UHD 4k 2160p |
105.745 |
0.009 |
| VQMT 13 Delta-Y |
1 core enabled |
UHD 4k 2160p |
107.198 |
0.009 |
| VQMT 13 Sigma-Y |
8 cores |
HD 720p |
101.870 |
0.010 |
| VQMT 13 Sigma-Y |
1 core enabled |
HD 720p |
38.839 |
0.026 |
| VQMT 13 Sigma-Y |
8 cores |
FullHD 1080p |
45.462 |
0.022 |
| VQMT 13 Sigma-Y |
1 core enabled |
FullHD 1080p |
17.164 |
0.058 |
| VQMT 13 Sigma-Y |
8 cores |
UHD 4k 2160p |
11.145 |
0.090 |
| VQMT 13 Sigma-Y |
1 core enabled |
UHD 4k 2160p |
4.211 |
0.237 |
Example (Blurring sigma)
Example (Blurring delta)
Legacy notes
In VQMT 12 metric was optimized, consider correct range, added legacy mode
MSU Blocking Metric
General info
- Metric type:
- no-reference
image
metric
- Value range:
- (no blocks) 0..∞ (a lot of blocks)
- Value interpretation:
- bigger is more blocks
- MSU VQMT implementations:
- CPU multithreaded
- MSU VQMT visualization:
- pixel-wise
- Available colorspaces:
- Y
- Output values:
- metric value
- Aggregated values:
- standard set
- MSU VQMT usages:
-metr blocking
Algorithm description
This metric contains heuristic method for detecting objects edges, which are placed to the edge of the block. In this case metric value is pulled down, allowing to measure blocking more precisely. This metric also considers image contrast around of block and use it as weight for obtained value.
Notes:
- This algirithm considers 8x8 blocks of image, so it applicable only for I frames of video and some of encoders.
Benchmark
| Implementation |
System & settings |
Resulution |
FPS |
Sec. per frame |
| VQMT 13 default-Y |
8 cores |
HD 720p |
403.223 |
0.002 |
| VQMT 13 default-Y |
1 core enabled |
HD 720p |
117.668 |
0.008 |
| VQMT 13 default-Y |
8 cores |
FullHD 1080p |
182.505 |
0.005 |
| VQMT 13 default-Y |
1 core enabled |
FullHD 1080p |
56.020 |
0.018 |
| VQMT 13 default-Y |
8 cores |
UHD 4k 2160p |
44.448 |
0.022 |
| VQMT 13 default-Y |
1 core enabled |
UHD 4k 2160p |
14.029 |
0.071 |
Example
Legacy notes
In VQMT 12 metric was optimized, consider correct range, added legacy mode.
General info
- Metric type:
- no-reference
image
metric
- Value range:
- (simple, monotone frame) 0..1 (very complex frame)
- Value interpretation:
- bigger more complex frame
- MSU VQMT implementations:
- CPU multithreaded
- MSU VQMT visualization:
- pixel-wise, sobel transformation
- Available colorspaces:
- Y
- Output values:
- metric value
- Aggregated values:
- standard set
- MSU VQMT usages:
-metr si- External links:
- ITU-T Recommendation P.910: Subjective video quality assessment methods for multimedia applications, 1999. - 37 p.
Algorithm description
This metric measures complexity (entropy) of an input image. This metric represents simplest SI realization that takes standard deviation of sequence of pixel values (Y-component) of Sobel transformation of input image:
is length of vector , where and are horizontal and vertical Sobel transformation. While calculating Sobel, the edge pixels will be excluded from calculation.
Benchmark
| Implementation |
System & settings |
Resulution |
FPS |
Sec. per frame |
| VQMT 13 default-Y |
8 cores |
HD 720p |
339.146 |
0.003 |
| VQMT 13 default-Y |
1 core enabled |
HD 720p |
95.112 |
0.011 |
| VQMT 13 default-Y |
8 cores |
FullHD 1080p |
149.358 |
0.007 |
| VQMT 13 default-Y |
1 core enabled |
FullHD 1080p |
44.072 |
0.023 |
| VQMT 13 default-Y |
8 cores |
UHD 4k 2160p |
37.605 |
0.027 |
| VQMT 13 default-Y |
1 core enabled |
UHD 4k 2160p |
11.157 |
0.090 |
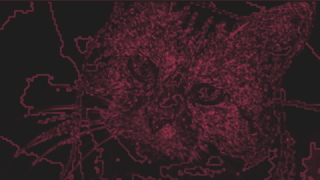
Example
Legacy notes
This metric firstly imlemented in VQMT 11, then excluded in VQMT 12 and returned in VQMT 13
General info
- Metric type:
- no-reference
temporal
metric
- Value range:
- (simple, static video) 0..1 (very diverse frames)
- Value interpretation:
- bigger more diverse frames
- MSU VQMT implementations:
- CPU multithreaded
- MSU VQMT visualization:
- pixel-wise, difference between adjacent frames
- Available colorspaces:
- Y
- Output values:
- metric value
- Aggregated values:
- standard set
- MSU VQMT usages:
-metr ti- External links:
- ITU-T Recommendation P.910: Subjective video quality assessment methods for multimedia applications, 1999. - 37 p.
Algorithm description
This metric measures complexity (entropy) of defference between consequent frames of input video. This metric represents simplest TI realization that takes standard deviation of sequence of differences of corresponding pixel values of a frame and previous frame:
Benchmark
| Implementation |
System & settings |
Resulution |
FPS |
Sec. per frame |
| VQMT 13 default-Y |
8 cores |
HD 720p |
691.497 |
0.001 |
| VQMT 13 default-Y |
1 core enabled |
HD 720p |
252.300 |
0.004 |
| VQMT 13 default-Y |
8 cores |
FullHD 1080p |
271.375 |
0.004 |
| VQMT 13 default-Y |
1 core enabled |
FullHD 1080p |
98.760 |
0.010 |
| VQMT 13 default-Y |
8 cores |
UHD 4k 2160p |
67.874 |
0.015 |
| VQMT 13 default-Y |
1 core enabled |
UHD 4k 2160p |
25.194 |
0.040 |
Example
Legacy notes
This metric firstly imlemented in VQMT 11, then excluded in VQMT 12 and returned in VQMT 13
License (Creative Commons Attribution)
These images by Compression.RU Team and MSU Video Group distributed under the terms of Creative Commons Attribution Lincense. In the examples we used materials from the following sources:
Please, don't hesitate to contact us in case of any question/problem. We are also open for feature requests
e-mail: video-measure@compression.ru
[an error occurred while processing this directive]
[an error occurred while processing this directive]
Other resources
[an error occurred while processing this directive]
[an error occurred while processing this directive]
[an error occurred while processing this directive]
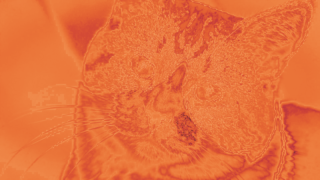
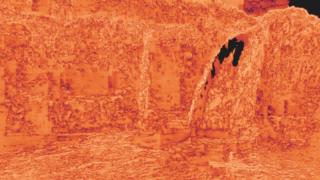
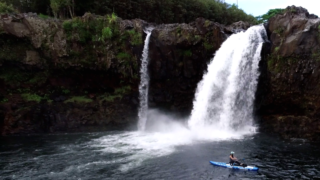
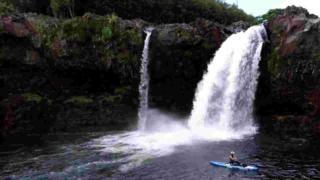
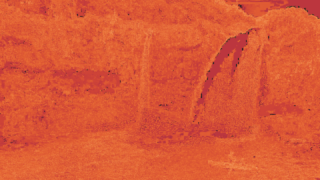
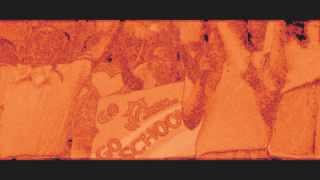
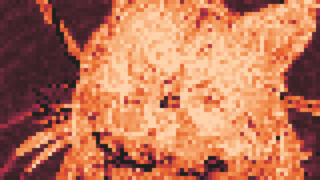
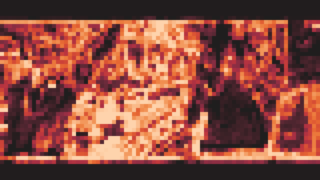
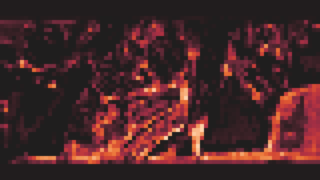
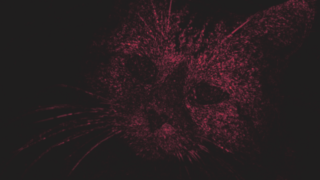
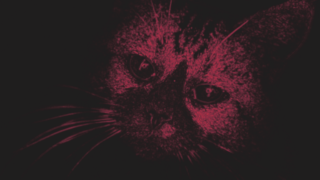
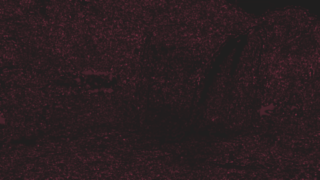
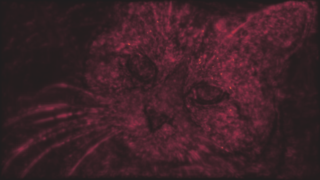
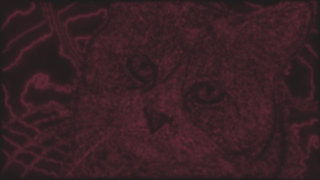
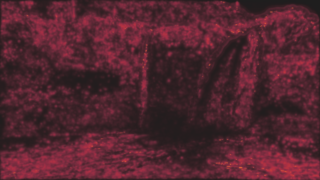
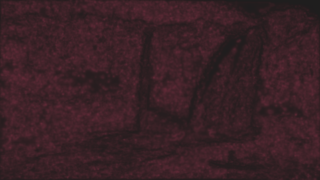
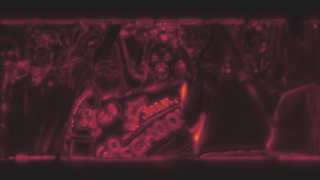
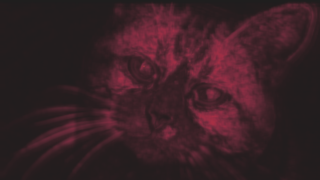
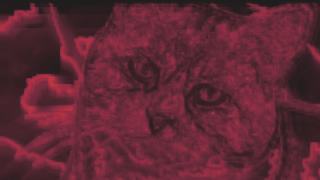
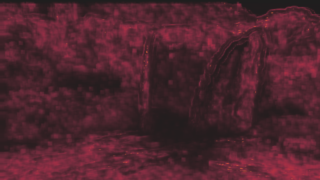
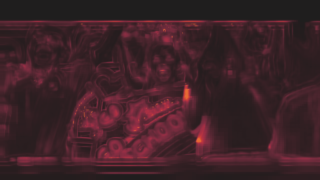
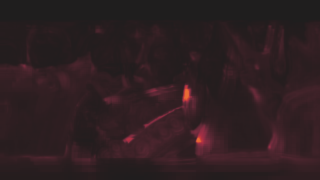
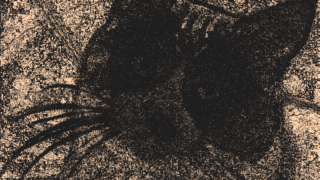
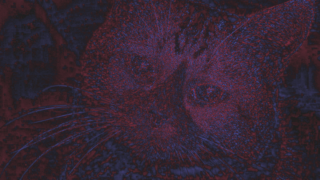
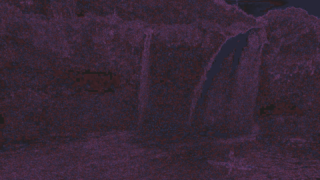
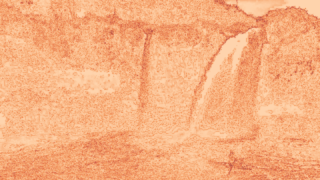
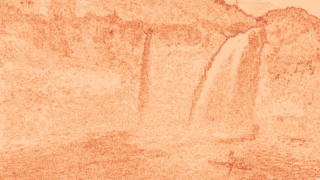
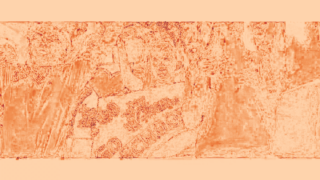
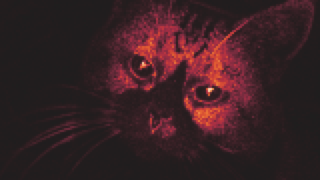
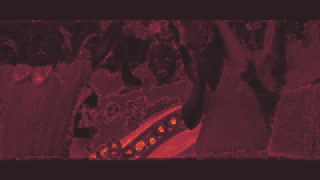
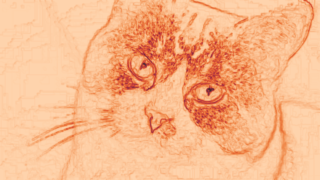
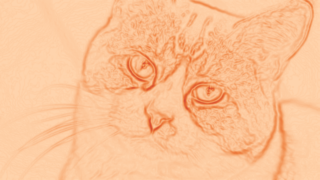
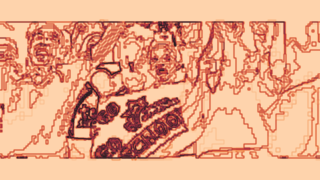
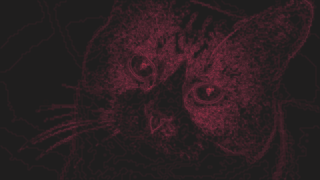
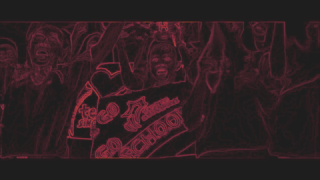
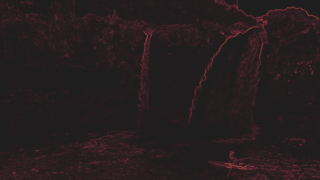
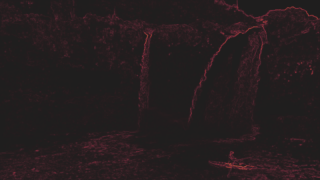
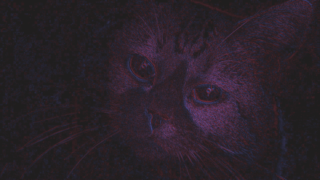
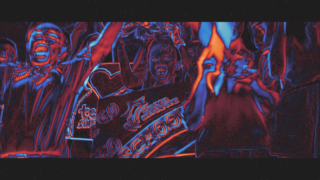
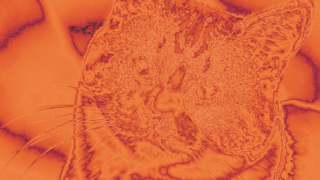
 Original

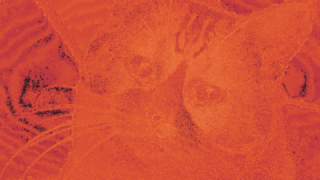
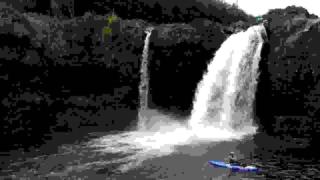
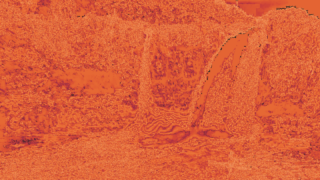
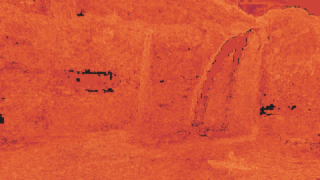
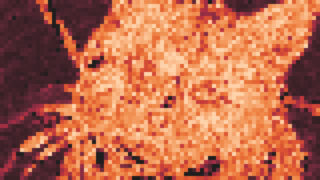
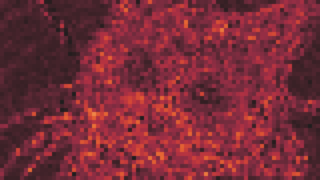
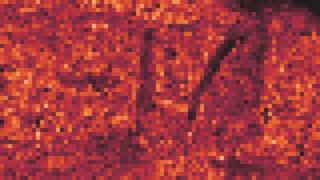
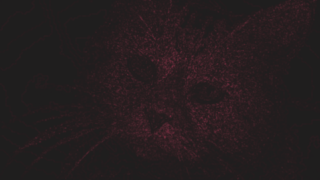
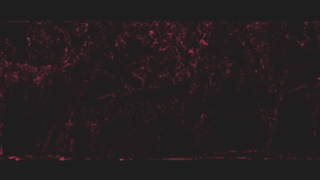
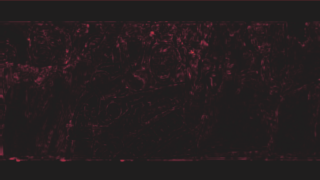
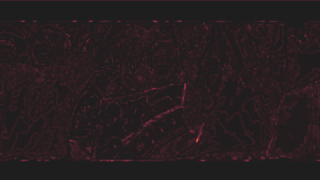
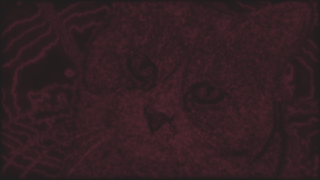
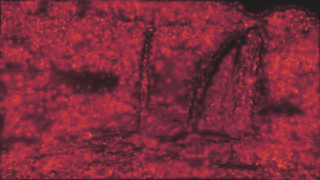
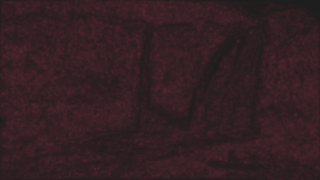
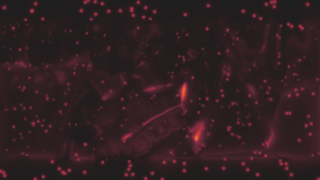
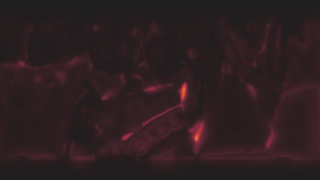
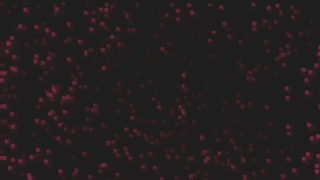
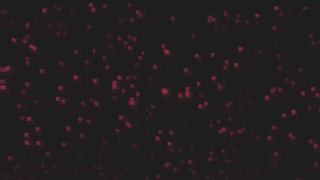
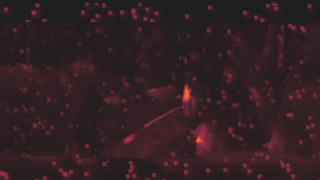
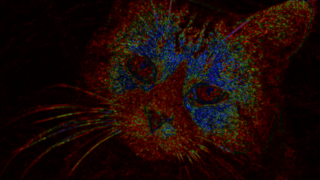
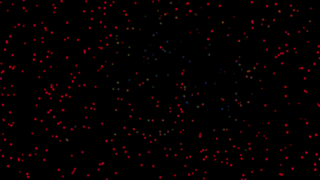
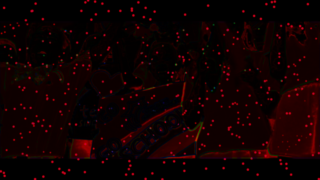
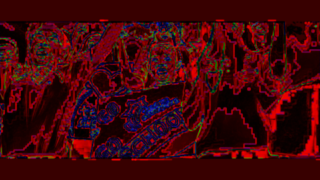
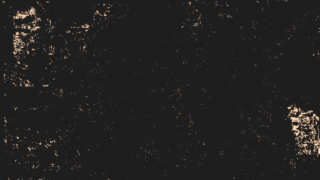
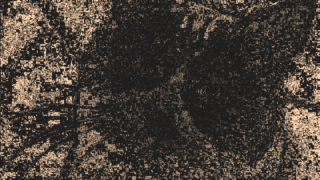
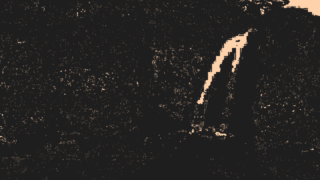
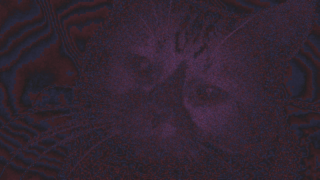
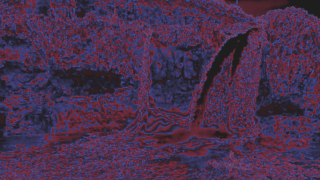
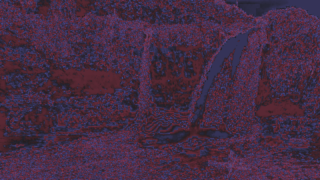
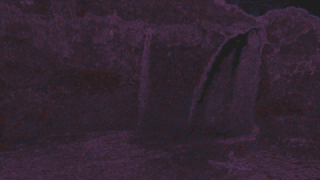
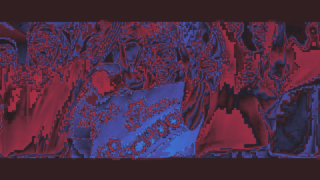
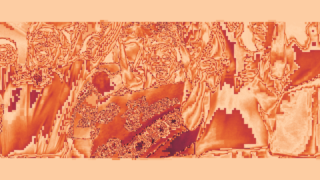
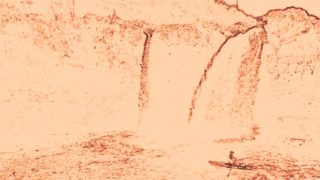
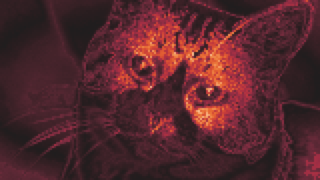
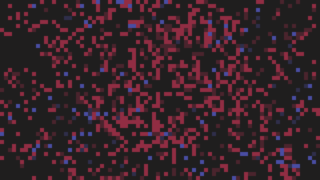
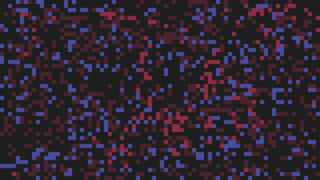
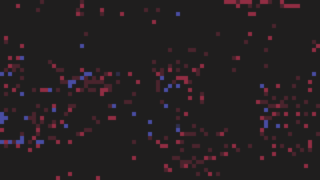
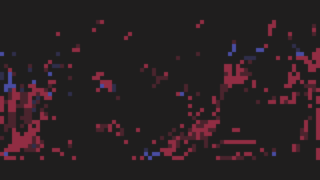
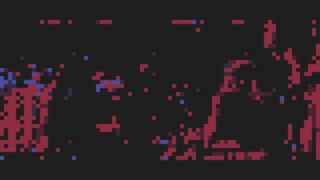
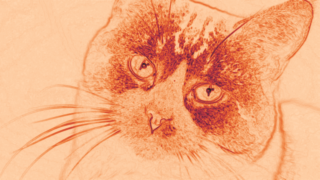
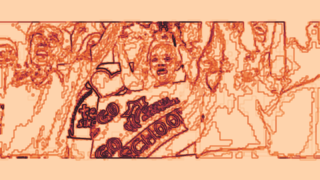
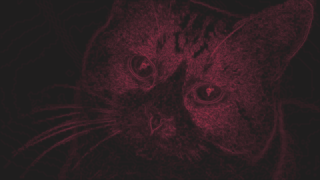
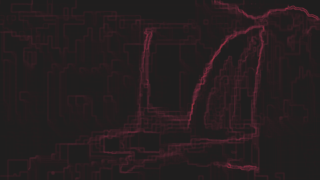
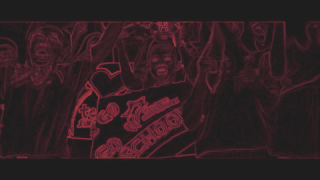
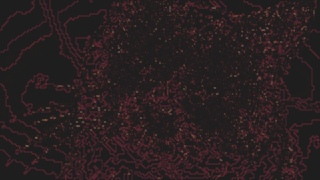
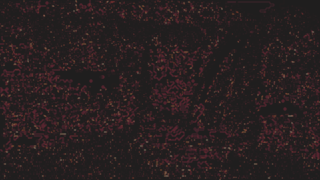
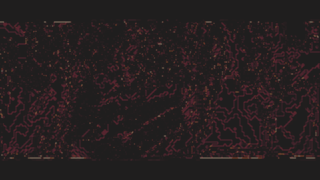
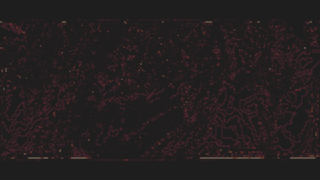
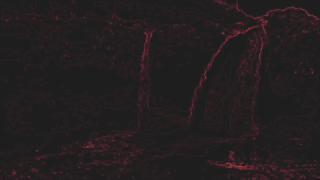
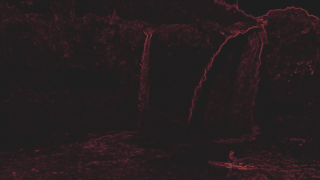
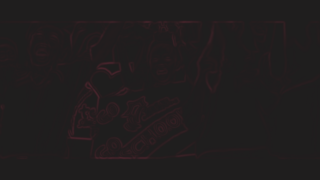
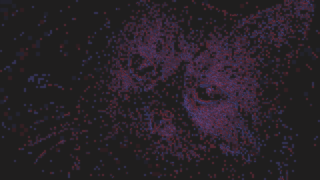
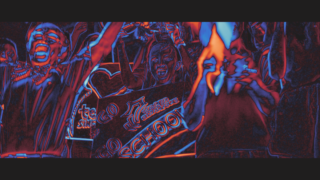
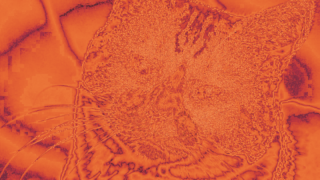
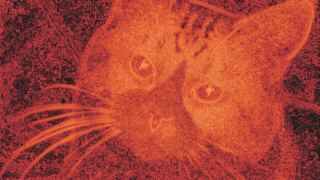
 Random points, PSNR-Y=37.97
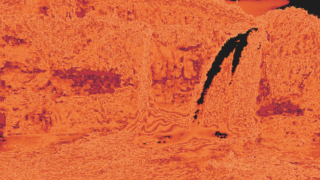
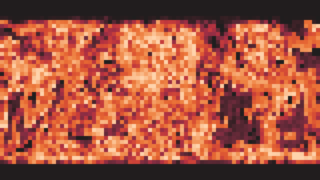
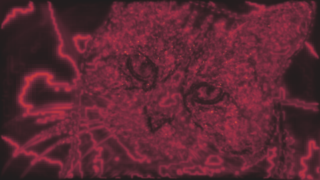
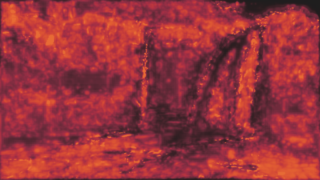
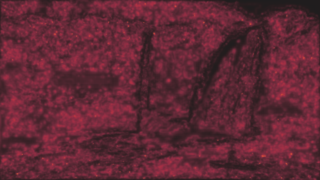
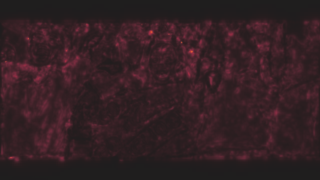
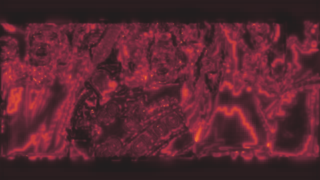
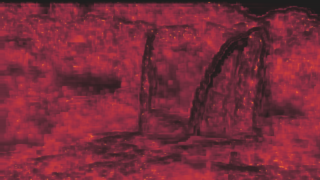
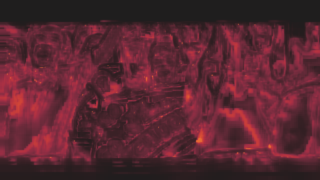
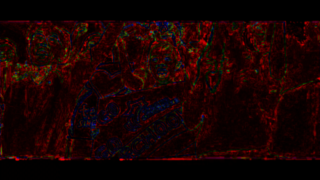
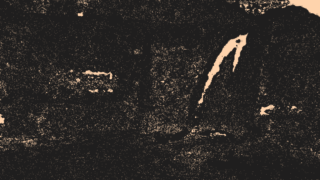
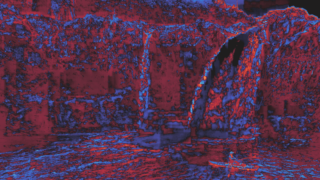
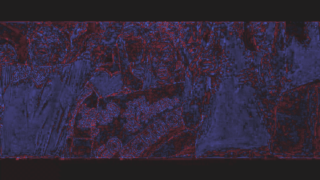
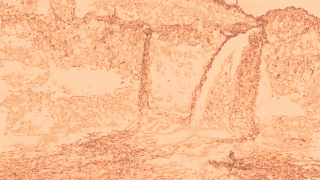
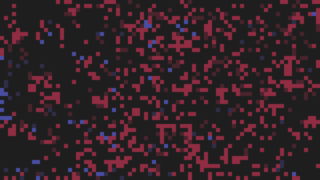
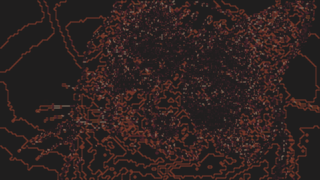
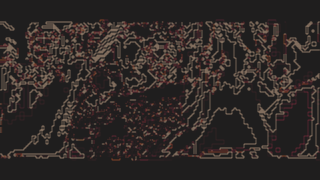
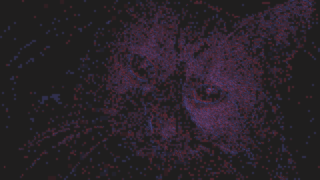
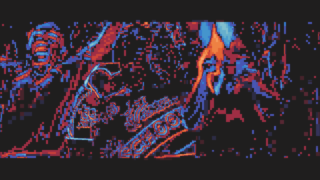
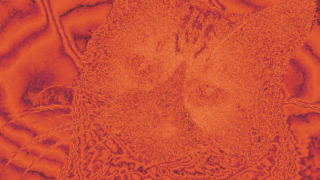
 MSU VQMT visualization
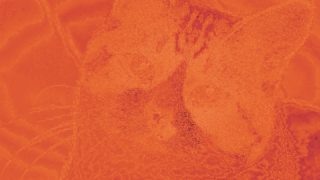
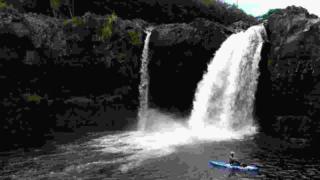
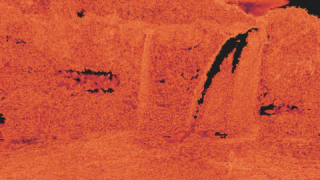
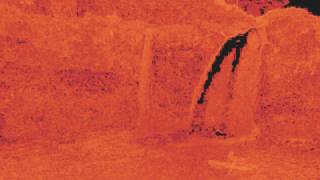
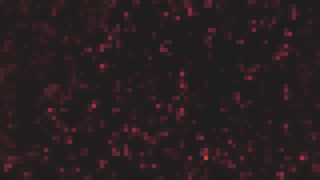
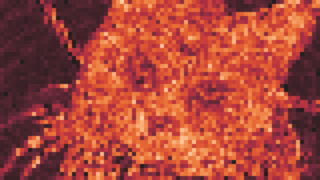
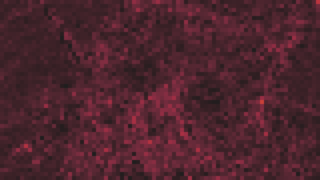
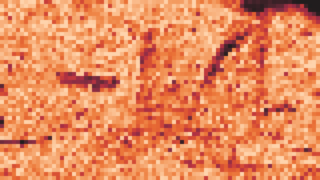
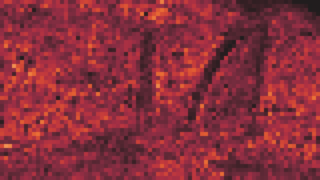
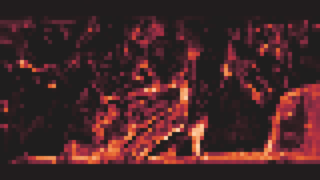
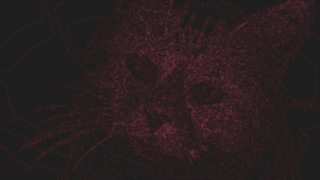
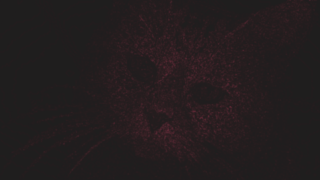
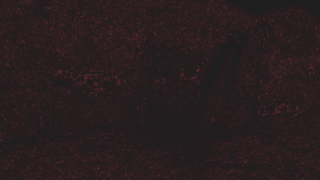
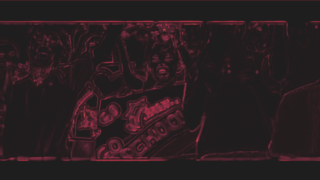
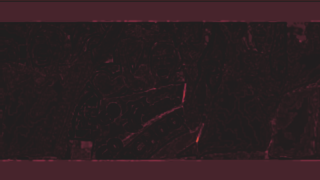
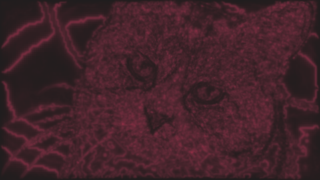
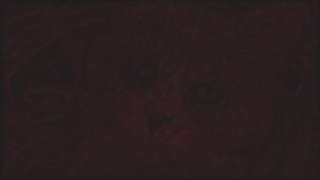
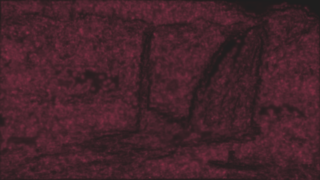
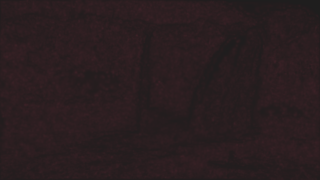
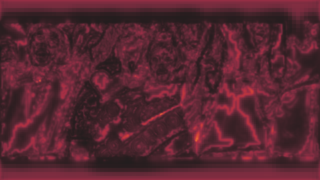
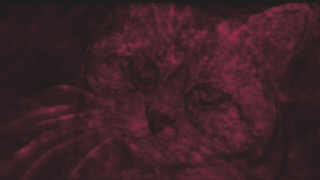
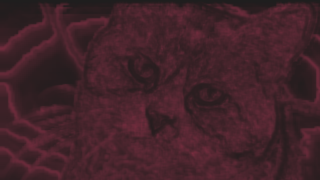
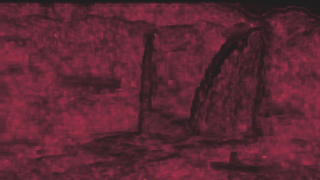
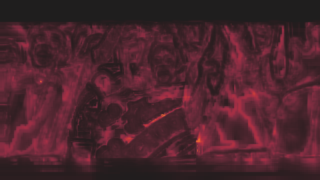
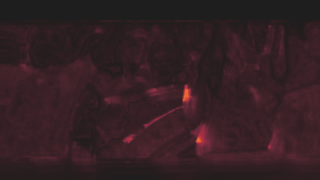
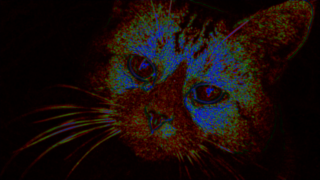
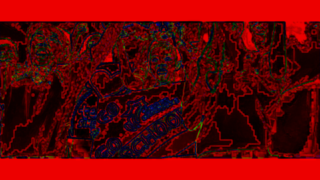
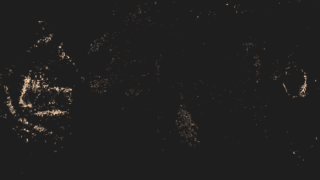
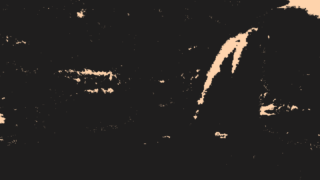
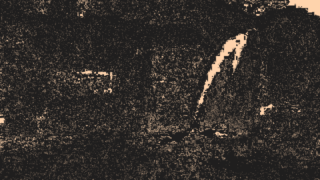
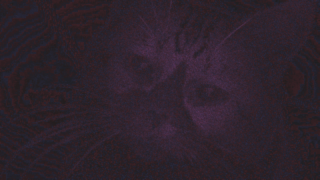
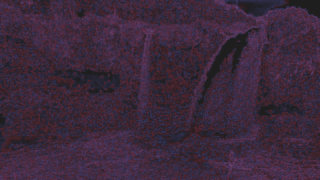
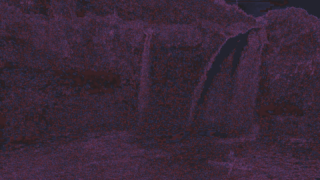
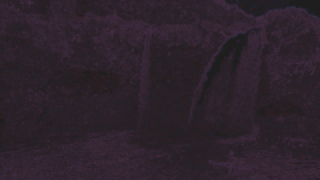
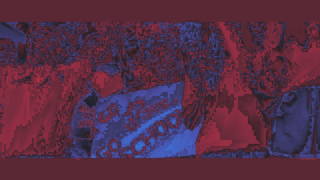
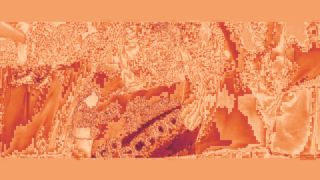
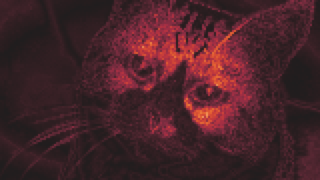
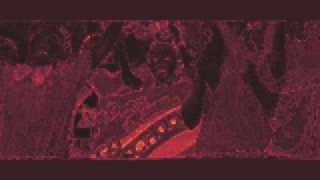
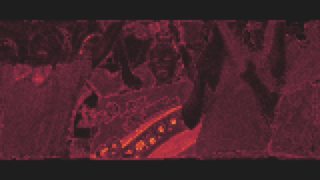
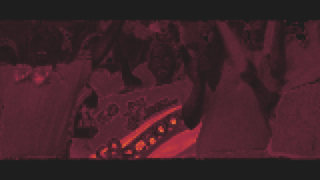
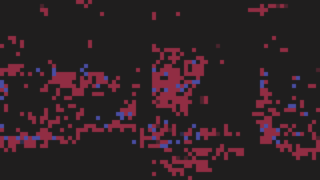
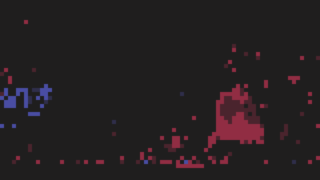
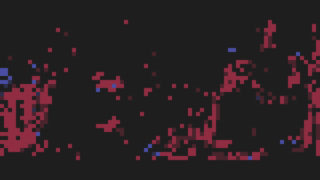
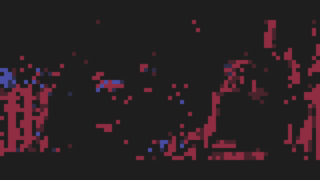
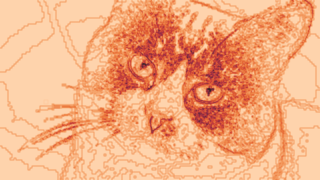
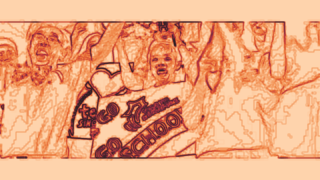
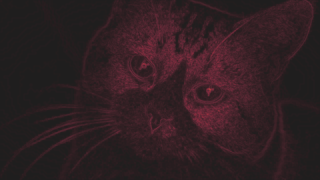
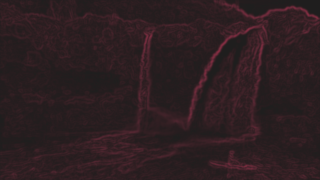
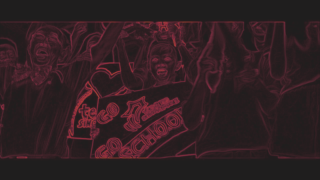
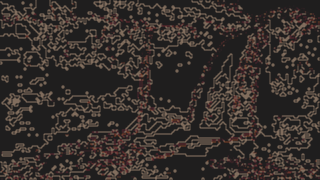
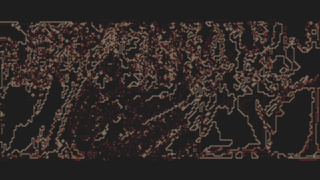
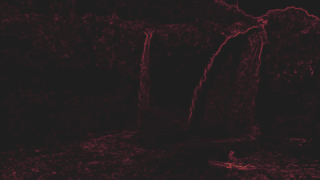
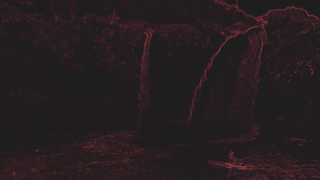
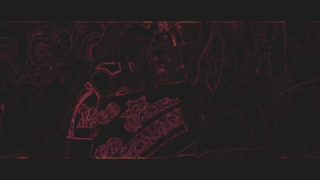
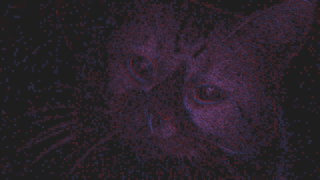
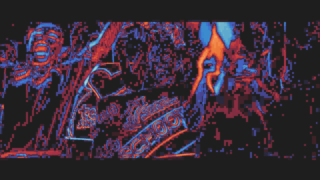
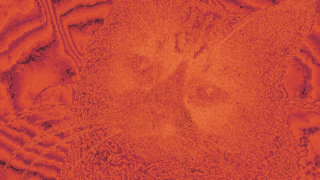
 Luminance shift, PSNR-Y=42.11
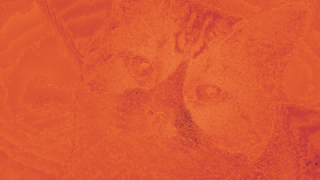
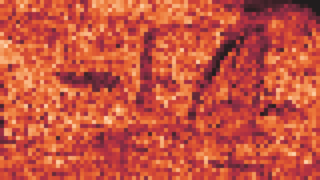
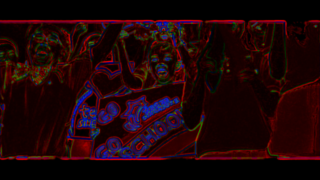
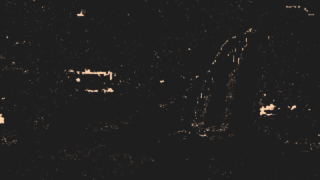
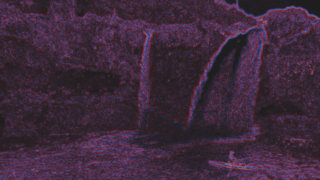
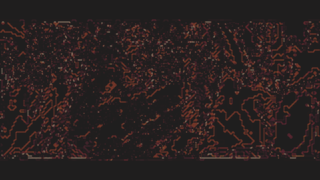
 MSU VQMT visualization
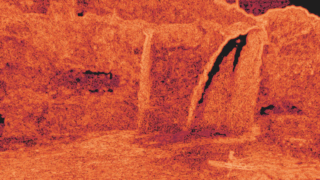
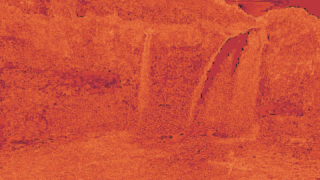
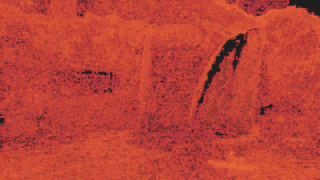
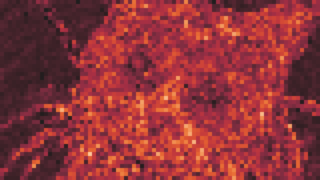
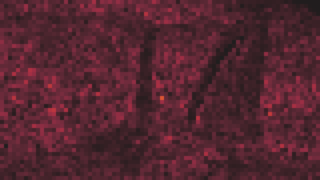
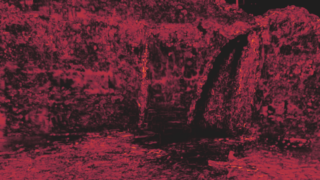
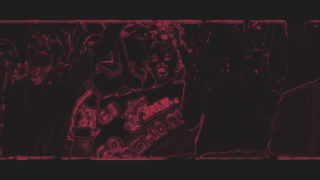
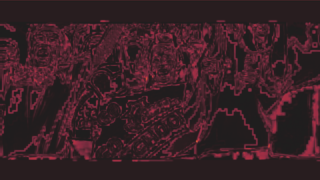
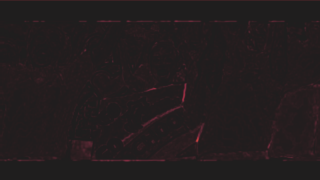
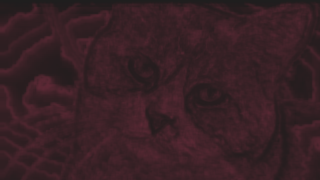
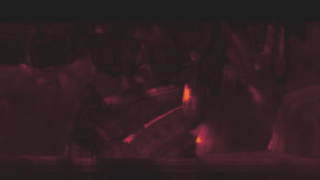
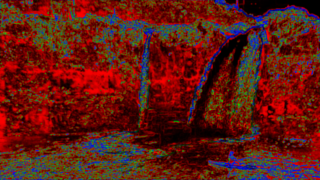
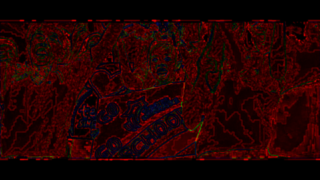
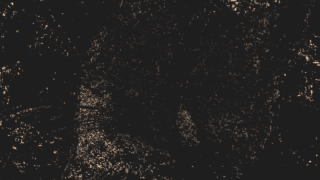
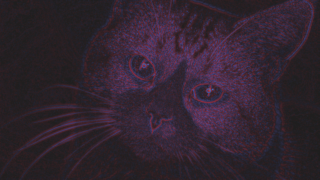
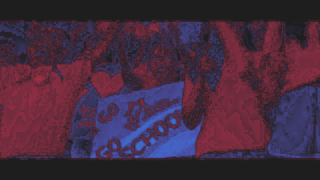
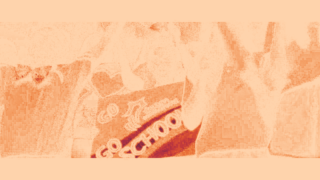
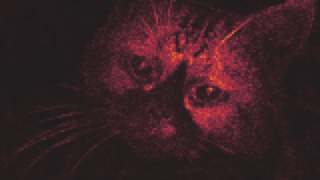
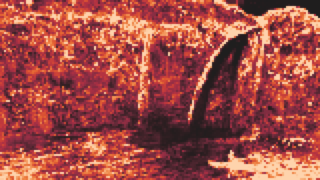
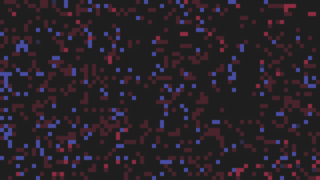
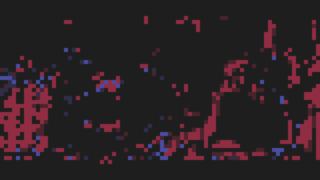
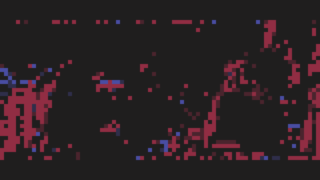
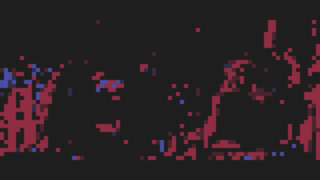
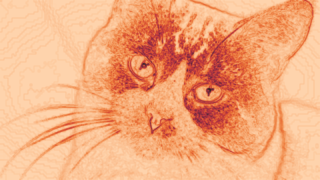
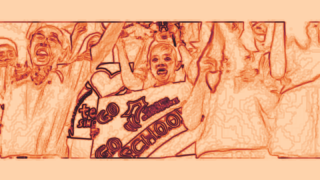
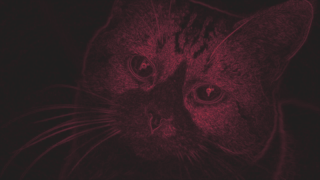
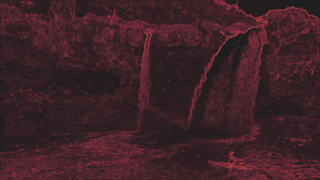
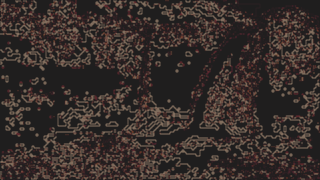
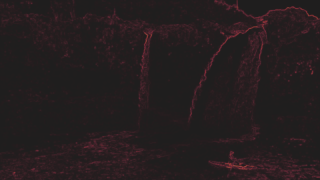
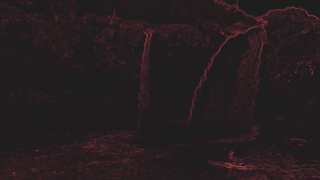
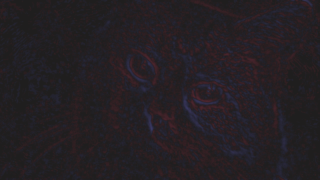


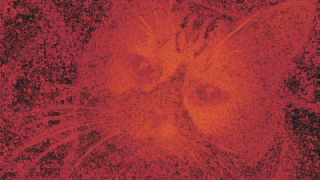
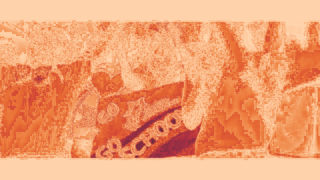
 MSU VQMT visualization
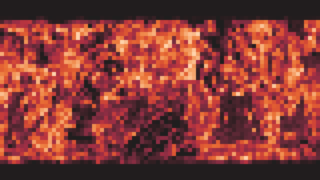
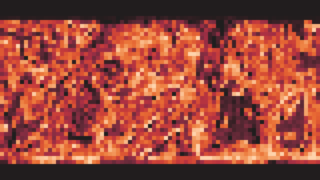
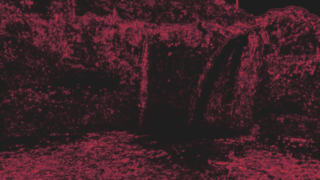
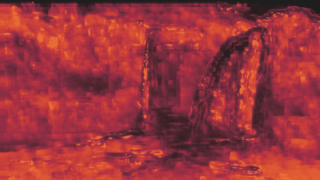
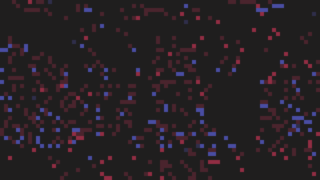
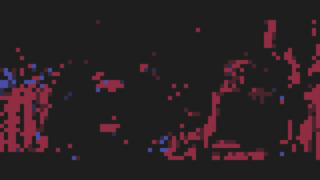
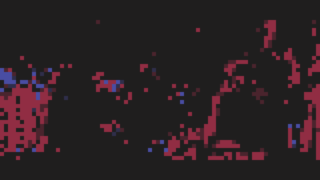
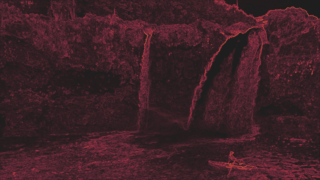
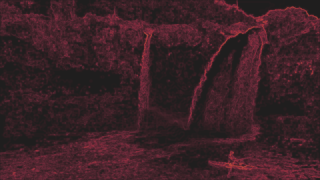
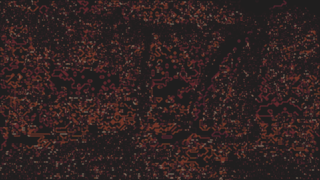
 MSU VQMT visualization